Published: 06-05-2026, 09:44 am
Gold is at a crossroads. The metal slipped to $4,448 this week (as of June 5, 2026, goldsilver.com/price-charts/), posting its worst weekly performance in a month. Rate-hike expectations — and the gold rate hike fears they’ve triggered — are the loudest headline. However, the structural picture — central banks, historical patterns, and the sound money case — tells a more layered story.
This digest covers five developments that matter for anyone holding precious metals. The short-term noise points one way. The long-term evidence points another. Understanding both is the job.
Why Are Gold Rate Hike Fears Driving Prices Down This Week?
Gold slipped to $4,448.72 per ounce on Friday (as of June 5, 2026, approximately 12:36 UTC; goldsilver.com/price-charts/), down roughly 2% from Monday’s open. Silver fell alongside it, trading near $72.65 per ounce. Every major precious metal — including platinum and palladium — posted weekly losses.
Two forces drove the move. First, hopes for a U.S.-Iran peace deal faded. Hezbollah rejected a ceasefire plan for Lebanon. Israel said it would maintain troops in the country. That geopolitical stalemate kept oil prices elevated, which in turn keeps inflation expectations firm — and firm inflation expectations keep the Federal Reserve hawkish.
Second, rate-hike fears intensified. Kansas City Fed President Jeffrey Schmid said the choice now is between holding rates steady or hiking further to contain inflation that has run above target for years. According to CME Group’s FedWatch tool, markets are now pricing a 51% probability of a Fed rate increase by December 2026. Higher rates raise the opportunity cost of holding gold, which pays no interest. That mechanism — not geopolitics alone — is the dominant driver of this week’s weakness.

The Edge Every Investor Needs Smarter precious metals investing starts here. The Nuggets Newsletter brings you essential market insights, Fed updates, global trends, educational videos, and much more.
What Does the U.S. Jobs Report Mean for Gold Today?
Gold is holding just above its 200-day simple moving average (around $4,432, based on technical analysis cited in FXStreet commentary, June 5, 2026). That level is the current line in the sand. The May nonfarm payrolls report — due later today — will determine whether gold breaks through it or bounces.
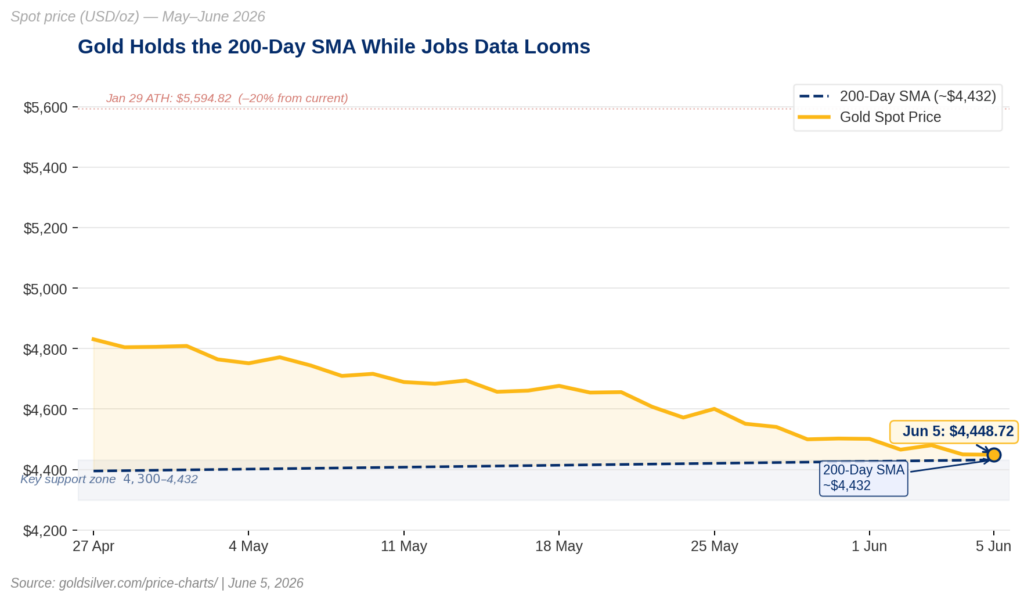
Economists expect headline job additions of 85,000 for May, down from 115,000 in April, with unemployment remaining at 4.3%. A reading above expectations would reinforce economic resilience. Consequently, it would strengthen the Fed’s case for keeping rates restrictive or hiking — and would likely push gold lower, toward the $4,350–$4,300 range. A weak reading would have the opposite effect. Traders would scale back rate-hike bets. Gold could reclaim the 21-day moving average near $4,551.
The Relative Strength Index on gold is sitting around 40 — territory that signals lingering bearish momentum. The MACD has slipped below zero. Neither reading is catastrophic. Still, they suggest the path of least resistance is sideways to lower in the near term, absent a meaningful catalyst.
Why Are Central Banks Still Buying Gold While Retail Investors Pull Back?
Central banks purchased approximately 244 tonnes of gold in the first quarter of 2026, according to World Gold Council data. Annualized, that pace would rank as the fourth-highest annual central bank demand since 1950. This is not a new trend. Purchases have exceeded 200 tonnes per quarter consistently since the start of 2025.
Retail demand, by contrast, has slowed. Global jewelry demand dropped 25% year-over-year in Q1 2026, to 260.2 tonnes (World Gold Council, Q1 2026 Gold Demand Trends). ETF inflows of 62 tonnes were down 73% from Q1 2025. India’s government raised taxes on gold imports. Chinese consumer jewelry demand fell 31%.
The divergence is instructive. Retail buyers respond to price. Central banks respond to structural conditions. And structurally, they see gold as a reserve asset that carries no counterparty risk, cannot be frozen by a foreign government, and does not depend on any issuer’s creditworthiness — unlike U.S. Treasury bonds. After Russia’s currency reserves were frozen in February 2022, non-Western central banks began diversifying systematically. That process has not slowed.
ING Economics commodities strategist Ewa Manthey summarized the near-term picture: “In the near term, gold will likely remain range-bound, with direction driven by U.S. rates, the dollar, and inflation.” The structural floor from central banks, however, is a different time horizon entirely.
Is Gold’s Pullback From January Highs Normal, or Is Something Different This Time?
Gold reached an all-time high of $5,594.82 per ounce on January 29, 2026. Since then, prices have pulled back roughly 20%, to current levels near $4,448. Historically, this kind of correction is not unusual after a strong rally. From October 2008 to September 2011, gold gained 170% — and then declined 37% over the following seven years. From August 2020 to September 2022, gold fell 22% after a 74% surge.
What drove the most recent rally — from September 2022 to January 2026 — was an unusual alignment of three forces simultaneously: rising central bank purchases, strong retail demand from China and India, and investor demand driven by inflation concerns, geopolitical risk, and dollar reserve status anxiety. Those forces pulled in the same direction for three years. They no longer do.
Central bank buying has moderated from its peak pace. Retail demand in China and India has cooled. The fear trade has shifted to rate expectations. As a result, gold is now more directly correlated to the Fed’s policy path than it has been at any point during the post-2022 rally.
The key question is whether the structural drivers — de-dollarization, fiscal deficit concerns, and central bank demand — have permanently repriced gold relative to other assets. Evidence suggests they have. Prices remain substantially above where they were before the structural demand shift began. That is not the pattern of a temporary speculative bubble. Furthermore, it aligns with what serious analysts argue about the long-term investment case.
What Does the Sound Money Case for Gold and Silver Look Like Right Now?
Economist Thorsten Polleit, who joined the board of a Swiss gold and silver storage firm in May 2026, recently outlined why he believes the long-term upward trend in precious metals remains intact. In an interview published June 4, 2026, Polleit — president of the Ludwig von Mises Institute Germany and a representative of the Austrian School of Economics — noted that gold has risen 94% and silver 135% over the past two years, pushing prices into historically significant territory.
Polleit described the global monetary system as a fiat regime that is structurally inflationary. He sees the current period of relative stability as temporary, with inflation and currency debasement remaining the primary long-term risks for savers. He noted that German households alone hold approximately 4.5 trillion euros in sight, time, and savings deposits — assets exposed to negative real interest rates, fees, and institutional default risk. Physical gold and silver, by contrast, carry no counterparty risk. They do not depend on bank opening hours, digital infrastructure, or an issuer’s solvency.
How Should Investors Position Between Gold and Silver Right Now?
His core recommendation is consistent with what the broader institutional record shows: hold both gold and silver as liquid assets. The allocation balance between them depends on the economic environment — a higher gold weighting during economic expansions, a higher silver weighting during contractions. The gold-silver ratio is one useful indicator for gauging that balance, though it should be read alongside other analysis, not as a standalone signal.
The structural argument is not new. But the institutional validation — central banks purchasing at the fourth-highest pace since 1950, economists with decades of monetary system experience increasing their conviction — is evidence that the long-term thesis is not fraying. It is strengthening.
That is not doomsday thinking. That is the definition of informed, long-term financial positioning.
Stay On Top of Gold & Silver Prices
Get important market alerts sent straight to your inbox.
SOURCES
1. GoldSilver — Live Gold & Silver Price Charts
2. CME Group — FedWatch Tool
3. World Gold Council — Gold Demand Trends Q1 2026
4. ING Economics — Commodities Research, Ewa Manthey
5. Ludwig von Mises Institute Germany — Thorsten Polleit
Disclaimer: This article is for informational purposes only and does not constitute financial or investment advice. Always consult a qualified financial adviser before making investment decisions.
You May Also Like:
- Gold at $4,480: Physical Demand Hits a 50-Year Milestone
- Gold Holds $4,481 With Rate Hike Risk Rising. Here’s the NFP Decision Map.
- Gold Surges 1.5%: ADP, ISM, and Beige Book Trap the Fed
- Gold at $4,454 Says the Fed Is Trapped. Here’s Why.
- Central Banks Picked Gold Over Treasuries. Should You?
- Central Banks Just Crossed a Line Not Seen Since 1996
- Factory Costs Hit 82.1. That Number Is Now Working for Your Gold.
- Gold at $4,500: What Fort Knox, China, and Silver Are Telling You
- Silver Has Two Engines. Stagflation Is the One Condition That Fires Both at Once.
- The Buyer List for Gold Just Got Longer. These Countries Have Never Bought Before.
- PCE Hit 3.8%. GDP: 1.6%. Gold Went Up. Here’s the Mechanism.