Daily News Nuggets | Today’s top stories for gold and silver investors
March 17th, 2026 | Brandon Sauerwein, Editor
Today’s gold price forecast for 2026 looks different than it did a month ago — not because the targets changed, but because the world did. Here’s what’s moving markets right now.
What Will the Fed Actually Signal Tomorrow?
The Fed’s decision drops tomorrow. Markets are nearly certain on the headline — futures are pricing a 99% chance the Fed holds at 3.5%–3.75%. But the rate decision itself is almost beside the point.
The real focus is the updated dot plot and Powell’s press conference. That’s where investors will look for clues on how the Fed plans to navigate a new wildcard: an oil-driven inflation spike tied to the Iran conflict.
The shift in expectations has been fast. Weeks ago, markets were leaning toward multiple cuts starting mid-year. Now April is off the table, June is a toss-up, and some economists see just one cut — or none — in 2026.
A more aggressive view is also emerging. Some analysts argue the Fed may need to consider hiking if energy prices push inflation back toward 3.5% this summer.
The Fed is caught between slowing growth and sticky inflation. If oil keeps climbing, the path to rate cuts narrows quickly — and that’s the kind of environment that tends to bring gold back into focus.
Why Isn’t Gold Reacting to the Iran Conflict?
Every gold price forecast for 2026 assumed some level of geopolitical risk. Few assumed this much — and yet gold’s response has been surprisingly muted. Prices are elevated — but not the kind of spike you’d expect from a full-blown geopolitical flashpoint.
The most likely explanation: the risk is already priced in. Markets have spent years navigating war in Ukraine, Middle East instability, and persistent global friction. That sustained pressure has kept gold well-supported. It’s also dulled the “shock factor” that typically drives sharp rallies.
Monetary policy is adding another layer of resistance. Elevated real interest rates and a firm dollar are reducing the urgency to rotate into gold right now.
The result is a market caught between two forces — geopolitical pressure pushing gold higher, tight financial conditions holding it back. If either side breaks decisively, the next move could be significant.
Can Silver Break Out After Lagging Gold?
Silver has tracked gold’s moves during the Iran conflict — spiking on the initial headlines, then pulling back as investors rotated toward the dollar and higher-yielding assets.
But silver’s story is more complicated than gold’s. It’s not just a safe haven. It’s also an industrial metal. That dual role means its next move may hinge less on geopolitics and more on global growth. If rising energy costs and trade disruptions slow the economy, industrial demand could weigh on silver near-term.
The longer-term setup looks different. Inflation tied to energy markets, tight supply, and structural demand from solar and electrification could turn any pullback into a buying opportunity.
There’s also a pattern worth noting. Silver tends to lag gold early in a cycle — then outperform when the move broadens. If inflation re-accelerates or monetary policy shifts, silver could move quickly from follower to leader.
How Much Does Gold Really Back U.S. Debt Today?
A chart from Azuria Capital’s Tavi Costa puts gold’s role in long-term perspective. In the 1940s, U.S. gold reserves covered more than 50% of government debt. Today, that figure sits closer to 3%.
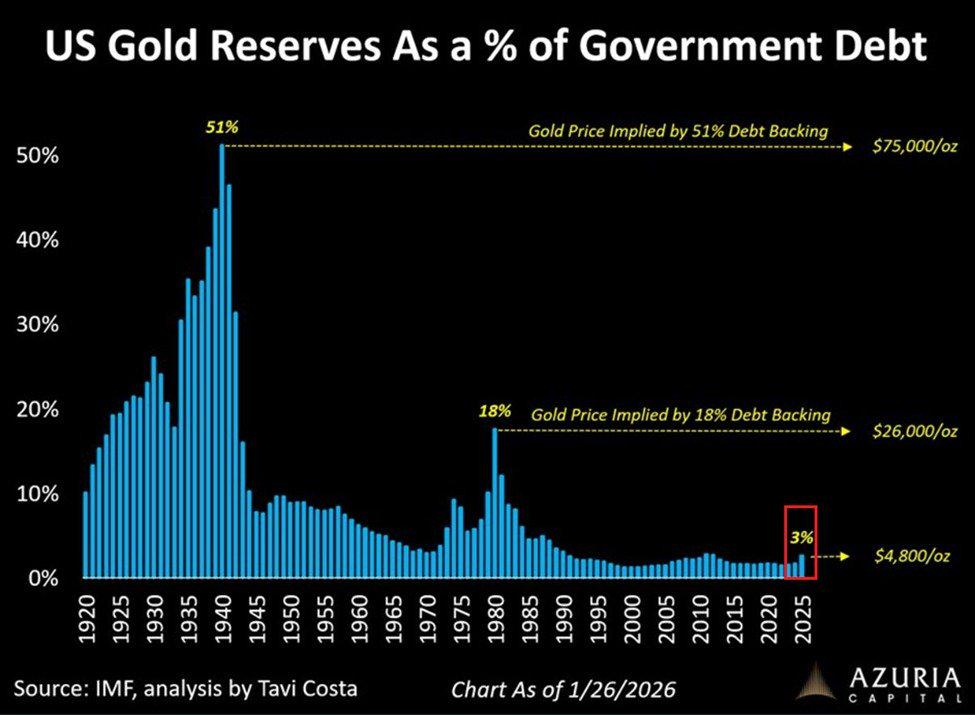
Source data: IMF / Tavi Costa / Azuria Capital (@TaviCosta).
That shift tells a bigger story. The financial system now relies far more on confidence in fiat currency. It is far less anchored to hard assets.
The gap between debt and reserves has widened sharply. Returning to 1980s-era backing levels would imply gold at $26,000 per ounce. That’s not a forecast. It’s a measure of how much debt has grown relative to tangible reserves.
What the chart really captures is a long-term role shift. Gold has moved from formal backing to informal insurance — a hedge against the risks of an increasingly leveraged system.
Where Do the Big Banks See Gold Going by End of 2026?
Wall Street’s gold price forecast for 2026 hasn’t wavered despite the pullback. Gold is hovering near $5,000 — and according to Wall Street’s biggest banks, that’s closer to a floor than a ceiling.
J.P. Morgan set a year-end 2026 target of $6,300 per ounce, citing central bank demand, ETF inflows, and a weaker dollar. Bank of America followed with a $6,000 target, pointing to Fed leadership uncertainty and historically low investor allocations to gold. BNP Paribas raised its 2026 average forecast by 27%, with a peak above $6,250 flagged as probable. Wells Fargo holds a $6,100–$6,300 range for year-end.
The numbers differ slightly. The reasoning is nearly identical: too much debt, too little confidence in paper assets, and central banks that keep buying.
Worth noting: these forecasts were largely set before the Iran conflict pushed oil above $100. The structural case — de-dollarization, fiscal stress, fading Treasury credibility — was already in place. The geopolitical premium is on top of that.
Gold has pulled back from $5,200 to $5,000. Not one of these targets has moved. History suggests that in sustained bull markets, pullbacks like this tend to look very different in hindsight.