Silver Rises Over 120% YTD


Published: 11-16-2026, 11:40 am | Updated: 11-16-2026, 11:47 am
Last verified November 16, 2026.
A November 9 Fed staff study estimates stronger links between oil prices and inflation, including a measure that excludes energy. Following a permanent 10% oil-price increase, its five-economy model puts the average core price level about 0.36% higher after three years under newer dynamics, against about 0.04% under older ones. These are conditional model results, not U.S. forecasts or annual inflation rates.
Key Takeaways
- Published November 9, the study uses data through Q2 2026.
- Its Figure 2 data show a larger, more persistent core-price response when both oil-price pass-through and inflation persistence increase.
- The paper also finds stronger pass-through in separate U.S. estimates. Its pooled numerical result remains a five-economy model comparison.
How do oil prices and inflation connect if core excludes energy?
Core inflation leaves out direct food and energy prices. But fuel is a cost of making and moving other goods. A seller may pass some of that cost to you later. Core can then pick up the price of the goods, not the fuel itself.
The researchers examined quarterly data from Canada, the euro area, Japan, the U.K. and the U.S. through Q2 2026. They used the core personal consumption expenditures (PCE) price index for the U.S. and core consumer price indexes elsewhere.
The model estimates stronger oil-to-core-price transmission from 2021 onward. It also estimates greater persistence: prior core inflation has more weight in later quarters. Together, those changes could leave a longer mark on what you pay.
The Edge Every Investor Needs Smarter precious metals investing starts here. The Nuggets Newsletter brings you essential market insights, Fed updates, global trends, educational videos, and much more.
What does the model’s price-level increase mean?
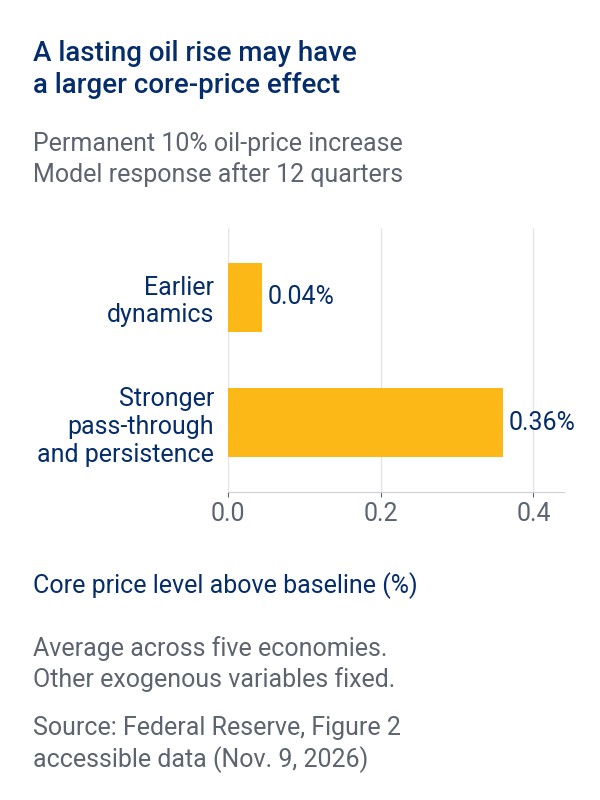
The chart assumes a permanent 10% oil-price increase and holds other outside factors fixed. Its accessible data put core prices about 0.04% above baseline after 12 quarters under earlier dynamics. With both stronger pass-through and persistence, the gap is about 0.36%. Most of that modeled rise builds over roughly eight quarters.
Data note: The Fed’s prose summarizes the results as 0.05% and 0.35%. This article and chart use the accessible table’s quarter-12 values, rounded to two decimals.
The gap concerns the price level, rather than an amount added to inflation every year. Figure 3 is a separate exercise using early-August 2026 oil futures. The authors describe those projected inflation paths as an upper bound rather than a central prediction.
Our November 2 report on oil and rate expectations covered the short market horizon. This study looks at how costs may spread over years.
What limits should U.S. readers keep in mind?
The November 9 note says second-round effects of the recent oil shock had not yet materialized. Its model cannot distinguish lasting changes in price-setting from the influence of unusually frequent or persistent global shocks. The newer data cover a short, unusual period.
The paper’s separate country estimates find a statistically significant increase in oil-price pass-through in the U.S. However, the pooled 0.36% result is not a U.S.-specific forecast. The authors also state that their results are not official Fed forecasts. If stronger pass-through or persistence fades, the modeled effect could be smaller.
What does this mean if you own gold or silver?
If non-energy prices keep rising, a fixed sum of cash buys less. That is a risk the model helps examine. Our October 21 look at how much oil an ounce of gold buys considers a different purchasing-power measure.
Gold does not track the next CPI reading one for one. The World Gold Council’s April 21, 2021 study compares year-over-year changes in U.S. CPI and dollar gold prices from Q1 1971 through Q4 2020. It finds a weak historical relationship. The gold-industry group also argues for a possible longer-term role, without guaranteeing returns.
Higher real yields can increase the opportunity cost of holding physical gold, which pays no interest. Storage costs and price swings also affect returns. The Fed study makes no gold or silver forecast.
Future U.S. data could test whether the stronger relationship persists. For long-term owners, the useful question is how purchasing-power risks fit within their overall plan.
Stay On Top of Gold & Silver Prices
Get important market alerts sent straight to your inbox.
SOURCES
1. Federal Reserve Board — The Effect of Oil Prices on Core Inflation: Recent Evidence from the Advanced Economies
2. Federal Reserve Board — The Effect of Oil Prices on Core Inflation: Recent Evidence from the Advanced Economies, Accessible Data
3. World Gold Council — Investment Update: Beyond CPI: Gold as a Strategic Inflation Hedge
4. World Gold Council — Gold Market Commentary
5. CFTC — Precious Metal Frauds
Disclaimer: This article is for informational purposes only and does not constitute investment advice. Past performance is not indicative of future results. Always consult a qualified financial advisor before making investment decisions.
You May Also Like:
- Gold Price Today Hits 13-Month Low, Silver Falls Faster
- Gold’s Price Higher Off 13-Month Low; Silver’s Isn’t
- 2026 Silver Deficit Forecast Shrinks; Tightness Eases
- October Budget Deficit: $404 Billion and the Gold Case
- Silver Mine Capacity: USGS Sees 4% Growth by 2030
- Gold Just Erased Its Entire Post-Election Rally
- Silver ETF Flows: India’s Data and U.S. Silver Owners
- Silver Outpaces Gold After CPI
- Gold Price Today: CPI Comes In Hot, Just as Waller Warned