Silver Rises Over 120% YTD




Published: 09-30-2026, 10:33 pm | Updated: 09-30-2026, 10:42 pm
Last verified September 30, 2026.
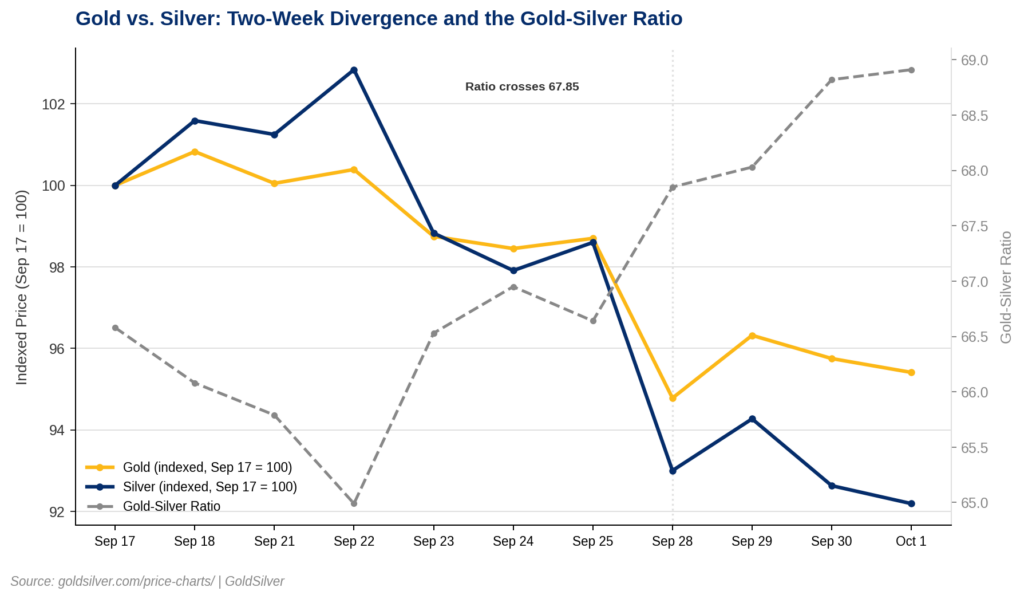
Silver fell 7.4% over the two weeks ending September 30, 2026 (GoldSilver Price Charts, Sep 30, 2026). Gold fell only 4.2% in the same stretch. You can check current gold and silver prices against that window yourself. Also, the gold-silver ratio, the number of ounces of silver it takes to buy one ounce of gold, climbed from 65.8 to 68.9. That’s the kind of move that gets financial media reaching for the nearest silver-specific headline. In September, that headline was solar.
It’s the wrong explanation. In fact, the real one applies to every future divergence between the two metals, not just this one.
Why Did Silver Fall Harder Than Gold in September?
Silver fell 7.4% over the two weeks ending September 30, 2026. Gold fell 4.2%, pushing the gold-silver ratio from 65.8 to 68.9. The cause was not solar panel makers using less silver paste, a real but separate trend. Specifically, CFTC positioning data shows no speculative long-liquidation event. Meanwhile, the 10-year real yield, the TIPS-indexed rate, rose from 2.83% to 2.90% in the same window (FRED, Sep 2026). That’s a mechanical driver. So it hits silver harder than gold because silver carries a higher macro-beta to the same real-yield move.
That’s the short answer. Here’s the mechanism underneath it, and why the solar story, despite being real, isn’t doing the work people think it is.
Is Silver’s Solar Demand Actually Shrinking?
Yes. The Silver Institute and Metals Focus forecast a 19% drop in 2026 solar silver demand (World Silver Survey 2026). That’s a fall from 186.6 million ounces to roughly 151 million ounces. That’s not a rounding error. It’s also happening at the same time investment demand for silver has been moving in the opposite direction in some major markets. In other words, industrial and investment demand for silver don’t always move together. Solar panel manufacturing became the single largest source of silver industrial demand over the past three years. Global installations consumed nearly 1 in every 4 ounces of mined silver by 2025. That’s up from 1 in 10 just six years earlier.
How Are Solar Manufacturers Cutting Silver Use?
The reversal has a name: thrifting. So the world’s three largest solar panel makers are LONGi, JinkoSolar, and Trina Solar. All three are shifting to copper-based electrical contacts that need far less silver paste per cell. Newer zero-busbar printing techniques are expected to push mainstream cells below 5 milligrams of silver per watt by 2027. Industry estimates put the savings at roughly $15 billion a year. That’s once the shift reaches full scale at 500 gigawatts of annual production. Silver’s own price run made it a meaningful share of a solar cell’s manufacturing cost. In response, the industry did exactly what a cost-conscious manufacturer would do: it engineered the expensive input out.
One widely syndicated analysis goes further, arguing thrifting could cut the 2026 deficit estimate roughly in half, to around 22 million ounces. Read that as one analyst’s estimate, not a Silver Institute revision. Other 2026 outlooks still cite the original 46.3 million ounces unchanged. Still, the same forecaster’s name has been attached to wildly different numbers elsewhere in financial media in September. That’s a reminder to check who is actually making a claim before repeating it.
The Knowledge That Changes Everything

Two essential guides — yours free. Understand why gold matters and why fiat currencies always fail.
Does a Shrinking Growth Story Mean the Deficit Is Over?
No, and this is the distinction that matters. Silver has run a structural supply deficit every year since 2021, with demand steadily outrunning mine supply plus recycling. The Silver Institute put the 2023 shortfall above 150 million ounces. Even on the most aggressive thrifting estimate circulating in September, the 2026 deficit shrinks. However, it does not disappear. Solar can lose its single biggest growth engine to engineering-driven substitution. The physical market, meanwhile, is still short more silver than it produces.
There are two separate claims wrapped up in most “silver bull case” commentary. Conflating them is the actual source of reader confusion in September:
- The growth story: more solar installations every year means more silver demand every year, forever. This is the part breaking. Thrifting and substitution are real, measured, and ongoing.
- The deficit: total silver demand still exceeds total mine supply plus recycling, every year, no matter which demand category grows fastest. This is the part that hasn’t changed.
A reader watching solar headlines and concluding that silver’s industrial case just broke is reacting to claim one. In fact, the price mechanism that actually moved in September has almost nothing to do with either claim. That’s the point.
What Does the Positioning Data Actually Show?
Suppose hedge funds and large speculators were panic-selling silver on the solar headlines. You’d expect to see it in the weekly Commitments of Traders report the CFTC publishes. You don’t. Net speculative long positioning in COMEX silver futures held roughly steady. It stayed that way across the three most recent reports (CFTC Commitments of Traders, Sep 2026). Specifically, it ran about 26,000 contracts on September 8, 25,300 on September 15, and 25,400 on September 22. Total open interest, meanwhile, grew roughly 3% over the same stretch. That is not the shape of a crowded trade unwinding. Instead, it’s the shape of a market where the big directional bets didn’t change much. So the explanation for the price move has to live somewhere other than panic selling.
Why Does Real Yields Explain the Divergence Better Than Solar?
Here’s the mechanism. The 10-year Treasury’s real yield is the return after subtracting expected inflation. It’s measured by the Treasury Inflation-Protected Securities market. It’s the number that actually prices gold and silver, not the nominal rate quoted on the news. Gold and silver pay no interest or dividend. So when the real yield on a government-guaranteed bond rises, the cost of holding a non-yielding asset instead rises with it. In short, an investor gives up more guaranteed, inflation-adjusted return every day they hold metal instead of the bond.
According to FRED, the Federal Reserve Bank of St. Louis’s economic data service, the 10-year TIPS real yield rose from 2.83% on September 25 to 2.90% on September 28. That’s a small move in absolute terms. But it pushes in the same direction against every ounce of gold and silver held for reasons other than industrial use.
Why Does Silver Move More Than Gold on the Same Yield Shift?
Gold and silver both face this same cost pressure. The difference is magnitude. Silver is roughly half monetary metal and half industrial commodity. In short, industrial uses, electronics, solar, and medical devices, make up 50% to 55% of annual demand. That dual nature means silver’s price carries more moving parts than gold’s.
Silver’s documented pattern is to move by a larger percentage than gold on the same catalyst, in either direction. That’s not because the industrial side changed anything in September. Instead, it’s because the monetary side of silver is simply more volatile than the monetary side of gold. A real-yield move that nudges gold down 4.2% has historically nudged silver down further. Historically, that’s closer to 1.5 to 2 times that percentage. That holds true no matter what’s happening to solar demand in the same news cycle. That ratio, not any solar headline, is the math behind September’s gap.
Is the Real-Yield Explanation Settled?
Not entirely, and the debate reaches well beyond precious metals circles. Ole Hansen, Head of Commodity Strategy at Saxo Bank, has argued gold’s traditional inverse link to real yields is decoupling (Saxo Bank, Sep 2026). On his view, fiscal-sustainability concerns are increasingly driving demand instead. So the current pullback could be noise around a relationship that no longer dominates the way it used to. That’s a genuine debate worth naming rather than papering over. The mechanical real-yield relationship this piece describes is well-evidenced over decades of data, and it moved in the textbook direction in September. Hansen may be right that the link is weakening structurally. Or, this may be normal short-term static around a persistent long-term signal. Either way, the next several months of data will answer that question better than this one can.
What Should a Silver Holder Watch Instead of Solar Headlines?
Mani Alkhafaji, President of First Majestic Silver, raised a different angle this week. He argues AI data-center infrastructure is adding new industrial silver demand. That could offset some of what solar is giving up. It isn’t the only sign the demand mix is shifting. Notably, a refining backlog at Scottsdale Mint surfaced in the same week’s institutional-access news. That’s a physical-supply-chain detail. It gets far less attention than any single demand forecast. That said, this is a single named executive’s view, not yet a tracked Silver Institute demand category. It’s worth watching as the composition of industrial demand shifts. However, it isn’t yet a verified data point to build a position around.
What Two Numbers Actually Explain Silver’s Month-to-Month Moves?
Two things are actually trackable every week, for free. One is the CFTC’s Commitments of Traders report, net speculative positioning, published Friday on Tuesday’s data. The other is the 10-year TIPS real yield from FRED. Those two numbers, read together, explain far more of silver’s month-to-month price action than any single industrial-demand headline, solar included. The deficit is the multi-year structural case. The real yield, by contrast, is the week-to-week mechanism. Confusing the two is how a reader ends up selling into noise instead of understanding the signal.
That structural case, for what it’s worth, remains intact regardless of September’s price direction. The broader precious metals bull market is still in its Public Participation Phase (Incrementum AG, In Gold We Trust 2026). That’s roughly the middle, not the end. Also, privately held gold represents just 2.7% of global financial assets. Silver sits inside that same multi-year thesis. It trades at a persistent structural deficit, with a long history of amplifying gold’s moves in both directions. A two-week pullback driven by a well-understood, textbook monetary mechanism is not a reason to abandon it. Instead, it’s a reason to understand which number actually moved the price, so the next one doesn’t get misread either.
Stay On Top of Gold & Silver Prices
Get important market alerts sent straight to your inbox.
SOURCES
1. Silver Institute & Metals Focus – World Silver Survey 2026 – April 15, 2026
2. FRED, Federal Reserve Bank of St. Louis – 10-Year Treasury Inflation-Indexed Security, Constant Maturity (DFII10) – September 28, 2026
3. U.S. Commodity Futures Trading Commission – Commitments of Traders Report, Silver (084691) – September 22, 2026
4. The Deep Dive – AI Is Making Silver’s Six-Year Deficit Worse, interview with Mani Alkhafaji (First Majestic Silver) – September 25, 2026
5. Saxo Bank – Gold Breaks With Real Yields as Fiscal Concerns Reshape Investor Demand – September 21, 2026
6. Incrementum AG – In Gold We Trust Report 2026 – May 20, 2026
Disclaimer: This article is for informational purposes only and does not constitute investment advice. Past performance is not indicative of future results. Always consult a qualified financial advisor before making investment decisions.
You May Also Like:
- K-Shaped Economy: Why Asset Owners Win and Wage Earners Don’t
- Gold in Medicine: Dental, Surgical, and Pharmaceutical Uses Explained
- What Is Gold Backwardation? The Rare Signal That Struck 3 Times in 2025
- A Bank Just Said the Fed Isn’t Done Hiking. Here’s the Math on What That Does to Gold.
- Gold Fell 23% This Year. One Number Explains Why.
- What Is the Debt-to-GDP Ratio, and What the US Number Tells You About Gold
- The World’s Last Zero-Rate Anchor Is Rising, and Gold Should Care
- What Is a FOMC Meeting? What the Fed Decides and How Gold Reacts