Silver Rises Over 120% YTD




Published: 08-17-2026, 03:31 pm
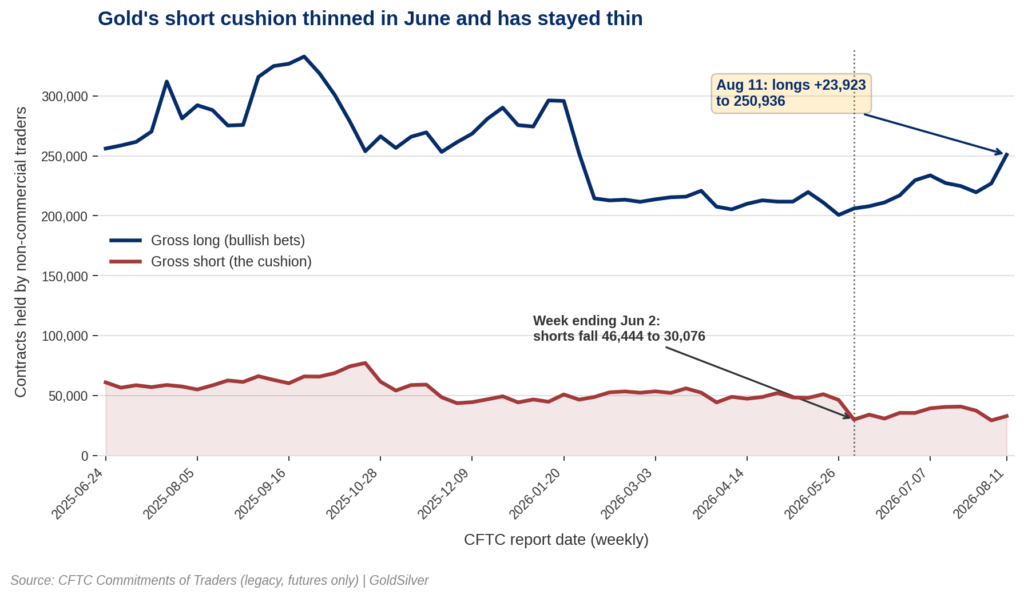
Speculative short positions in COMEX gold collapsed 35% in the week ending June 2 and have stayed thin for ten weeks. On August 11 buyers added 23,923 long contracts on top of that gap, and it changes what a dip would mean.
Why is gold not going up? It rose only 0.64% Monday to $4,405 an ounce, and it still cannot clear $4,500. The reason is not the Fed. It is not the dollar either. Gold’s futures market has been missing one of its two sides since early June. This week, buyers piled in on top of that gap.
Start with what is not new. Gross short positions in COMEX gold fell from 46,444 contracts to 30,076 in the week ending June 2. That is a drop of 35% in one week, per the CFTC’s Commitments of Traders report for the week ending June 2, 2026. They have stayed down since. All nine weeks in the past 60 with gold’s short base under 40,000 contracts came after that June date. Today the figure is 32,996 contracts. That is 64% of the 60-week median of 51,716.
What does a short position do in the gold market?
The CFTC publishes this data every Friday, covering positions held the previous Tuesday. Its non-commercial category is the speculators. These traders want to profit from price moves, not hedge a mine’s output or a refiner’s inventory. Net length is their bullish bets minus their bearish ones.
The bearish ones matter more than they sound. A short seller closes a position by buying. Shorts are therefore the buyers of last resort on a decline. That buying is the shock absorber under the market. Each COMEX gold contract covers 100 troy ounces, per CME Group’s COMEX rulebook. So today’s short base amounts to roughly 3.3 million ounces of standing demand. Through May, by contrast, the cushion averaged about 54,900 contracts.

The Edge Every Investor Needs Smarter precious metals investing starts here. The Nuggets Newsletter brings you essential market insights, Fed updates, global trends, educational videos, and much more.
What changed in gold positioning this week?
Gross long positions jumped 23,923 contracts to 250,936 in the week ending August 11. That is the highest of the ten-week stretch. Total open interest rose 28,758 to 400,309. That combination is the tell: fresh money arrived, rather than shorts closing out.
Net length reached 217,940 contracts. That is 54.4% of all open interest, a new high for the 60 weeks we track. The margin is thin, however, because June 2 registered 53.99%. The record is not the point. Buyers have committed heavily into a market that already had almost nobody on the other side.
Why is gold not going up past $4,500?
Because the trade is crowded on one side. Speculative net length reached 54.4% of all COMEX open interest in the week ending August 11, the highest share in 60 weeks. A market this heavily committed has no marginal buyer left, so supportive news cannot lift the price.
Gold received the news it wanted this month. Odds of a September Fed rate hike have fallen to roughly 31%, down from about 40% a week earlier, per CME’s FedWatch tool on August 14, 2026. The dollar softened too. Last week was gold’s best since January.
The traders who would buy good news have already bought it. That is not a bearish forecast, it is arithmetic. J.P. Morgan Global Research, in its June 2026 outlook, sees gold averaging $6,000 an ounce by the fourth quarter. Even so, its Greg Shearer calls the metal stuck in technical no-man’s land.
Is silver positioned the same way as gold?
No. Silver climbed 1.60% Monday to $65.74, more than double gold’s gain. Both prices are as of 19:11 UTC on August 17, 2026, per goldsilver.com/price-charts/. Yet silver’s speculative net long is 23,646 contracts. That is just 20.5% of its open interest, and 48th of the past 60 weeks. Against its 60-week peak of 63,400 contracts, the crowd sits at 37% of full strength. Silver is therefore rising without a crowd. Gold is grinding with one. This is a story about positioning, not about metals in general.
Stay On Top of Gold & Silver Prices
Get important market alerts sent straight to your inbox.
What does crowded positioning mean if you own physical metal?
None of this changes the number of ounces in existence. Open interest of 400,309 contracts represents about 40 million ounces of paper claims. Those claims are priced by sentiment on a screen. The ounce in a vault, by contrast, is not a position a margin call can close out.
That is the distinction worth holding onto. Futures positioning sets the daily price. It does not set the reason for owning sound money. That case rests on monetary expansion, deficits, and purchasing power measured in decades. When a crowded paper trade unwinds, the quoted price falls. The ounce, and the argument for holding it, stays where it was. For a saver on a five-year view, that is a discount rather than a warning.
Two dates are worth marking. Minutes from the July FOMC meeting land Wednesday, August 19 at 2:00 p.m. Eastern, according to the Federal Reserve’s release calendar. The next COT report arrives Friday, August 21. It covers positions as of August 18, and will show whether this crowd grew.
Frequently asked questions
The Commitments of Traders report comes out every Friday afternoon from the CFTC. It covers futures positions held the previous Tuesday. The report splits open interest by trader category, so you can see whether speculators or commercial hedgers are driving a market.
Positioning is stretched rather than price being extreme. Speculative net length is at a 60-week high as a share of open interest. Gross long contracts, however, rank only 33rd of those 60 weeks. The imbalance comes from an unusually small short side, which makes the market fragile to a shakeout. That says nothing definitive about direction.
No. Futures positions are claims that a margin call can force closed, and they set the daily quoted price. Physical metal cannot be liquidated by someone else’s leverage. A positioning unwind moves the price without changing how much metal exists, or why a long-term saver holds it.
SOURCES
1. CFTC — Commitments of Traders (Legacy, Futures Only), data as of August 11, 2026, released August 14, 2026
2. CME Group — COMEX Rulebook Chapter 113: Gold Futures, accessed August 17, 2026
3. CME Group — CME FedWatch Tool, August 14, 2026
4. Federal Reserve — August 2026 Release Calendar, accessed August 17, 2026
5. J.P. Morgan Global Research — Gold Price Predictions for 2026 and 2027, June 2026
6. GoldSilver — Live Gold and Silver Price Charts, August 17, 2026, 19:11 UTC
7. Investing.com — CFTC Gold Speculative Net Positions, August 14, 2026
Disclaimer: This article is for informational purposes only and does not constitute investment advice. Past performance is not indicative of future results. Always consult a qualified financial advisor before making investment decisions.
You May Also Like:
- JP Morgan Just Flagged a Silver Demand Warning. Silver Rose Anyway. Here Is Why
- Gold Needed One Thing to Break $4,400. It Just Got Five of Them.
- Zero Tankers Crossed Hormuz on Sunday. Oil Hit $89. Gold Barely Moved.
- Gold Rebounds to $4,392 as Sentiment Crashes to 51 and Inflation Expectations Rise
- Gold Price and the September Fed Pivot: Five Data Prints Rewrote the Odds This Week
- The Fed’s September Math Just Changed. Here’s What It Means for Gold.