72% of Family Offices Hold No Gold. What They’re Missing.

Nearly three-quarters of the world’s most sophisticated investors hold no gold. The reasons are psychological, structural, and surprisingly relevant to your own portfolio decisions.
How Gold Once Balanced the World’s Economies — And Why It Matters Now

For most of recorded history, trade between nations was governed not by policy meetings or central bank coordination — but by gold. Here’s how the gold standard’s built-in correction mechanism worked, and what its absence means for the $102 trillion in global public debt recorded as of 2024.
The Institutions Are Buying. Yields Are Rising. What Does That Tell You?

Goldman Sachs revealed central bank gold demand was being systematically undercounted. HSBC raised silver forecasts but flagged real limits. Treasury yields hit a one-year high. The institutions that understand sovereign debt risk best are still buying. Here’s what’s driving each story.
What Do Central Banks Know About Gold That You Don’t?

Central banks purchased a net 244 metric tons of gold in Q1 2026 — the fastest pace in over a year — despite prices hitting a record $5,405 per ounce. The World Gold Council data reveals who’s buying, who’s selling, and why this relentless accumulation at all-time highs signals a growing loss of confidence in fiat currencies. If central banks are protecting themselves regardless of price, the rest of us should be paying attention.
India Gold Import Duty: Does a Hike Actually Kill Demand?

Indian rupee banknotes beside a 1000g fine gold bullion bar on a dark surface — illustrating India’s gold import duty hike and the rupee vs gold tension.
Gold vs. Bitcoin: Which Hard Asset Will Protect Your Wealth?

Gold and Bitcoin both claim the “hard asset” crown — but the data tells a nuanced story. While Bitcoin delivered 121% gains in 2024, gold absorbed every market shock with far less damage to your portfolio. Here’s how to decide which belongs in yours.
Why Gold Deserves a Permanent Spot in Your Portfolio
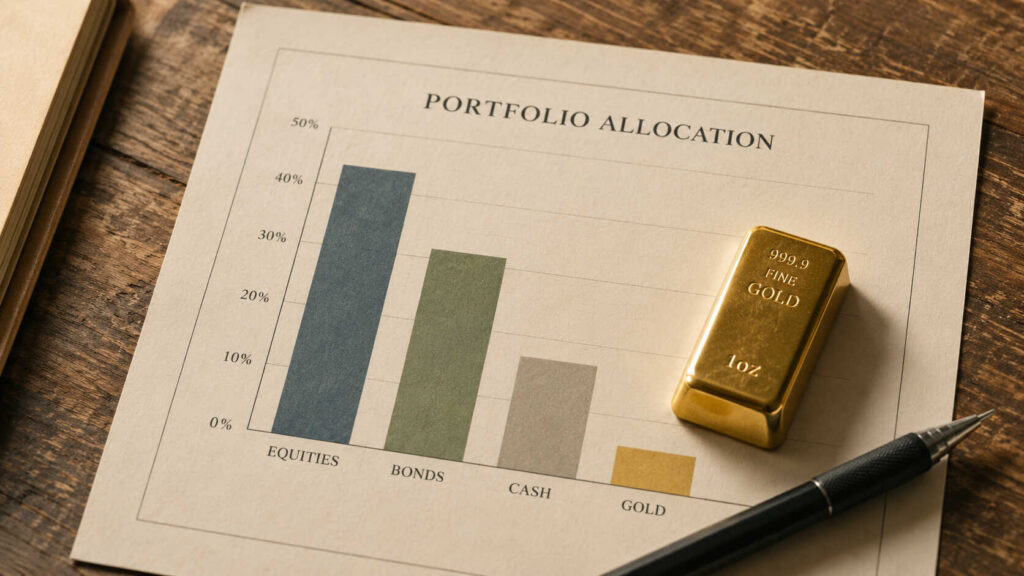
Central banks bought 863 tonnes of gold in 2025 at record prices. Institutional allocations are rising. The 60/40 portfolio has structurally weakened. The case for gold as a permanent portfolio holding has never been more data-driven.
Why Gold Stabilizes — and Silver Amplifies

Gold and silver share the same label—but they don’t play the same role. Gold stabilizes your portfolio through market uncertainty, while silver amplifies both gains and losses. Learn the structural differences between the two metals, and how understanding each one’s unique behavior can help you build a more resilient, strategically balanced investment portfolio.
What the Gold Price Per Ounce Really Tells You

Most investors glance at the gold price per ounce and move on. But this single number reveals more about the health of the monetary system than almost any other metric — here’s how to read it.
Gold Bullion vs. Jewelry: Why Serious Investors Choose the Bar

Not all gold is created equal — at least not when it comes to what you pay for it. Here’s why the form of your purchase matters as much as the decision to buy.
