 Silver Rises Over 120% YTD




Warsh Sat Out the Dot Plot. The FOMC Minutes Drop Wednesday.
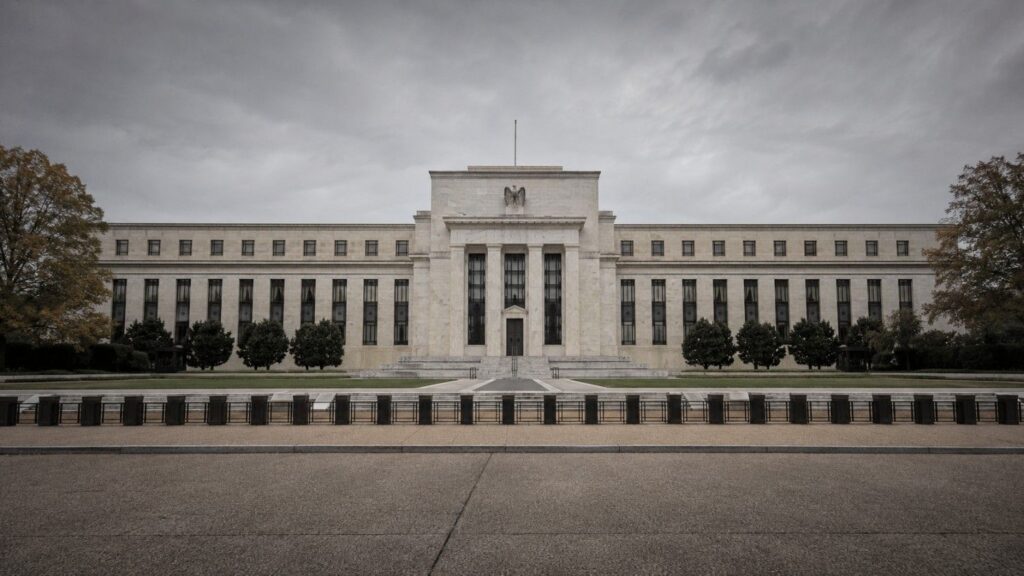
The Federal Reserve releases the FOMC minutes from its June 16–17 meeting on Wednesday, July 8 at 2:00 p.m. ET. The committee came out nine to nine on whether to raise rates in 2026. Here is what the minutes will reveal — and why the real-yield mechanism makes them the most important data point for gold holders this week.
Why Is Gold So Expensive? The 5 Mechanisms Behind the Price
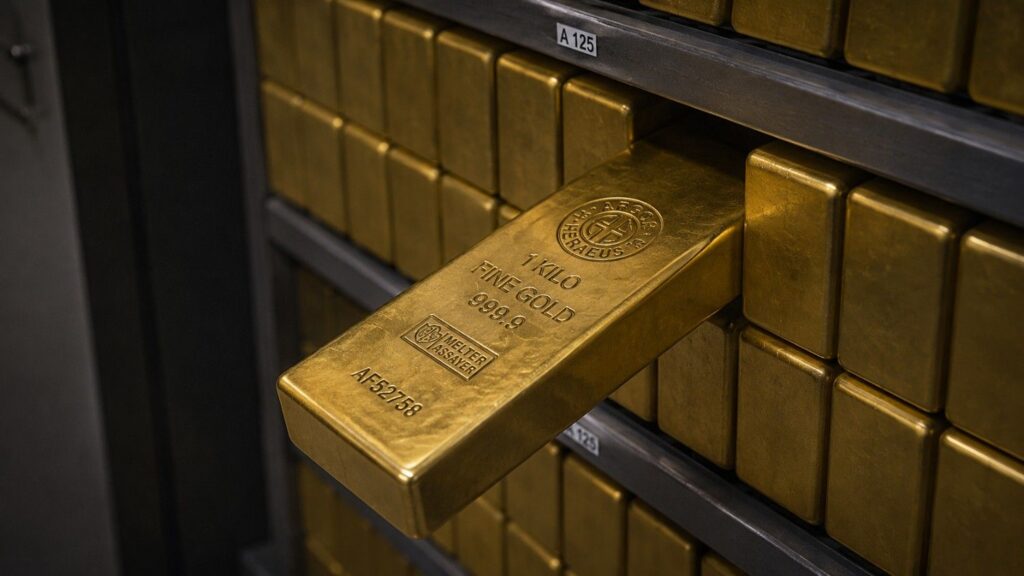
Gold costs roughly $4,000 per ounce today. Here are the five specific, measurable forces that explain exactly why — and why every major bank expects the price to go higher.
172,000 Jobs Doubled the Forecast. Thursday’s Report Could Move Gold Again.
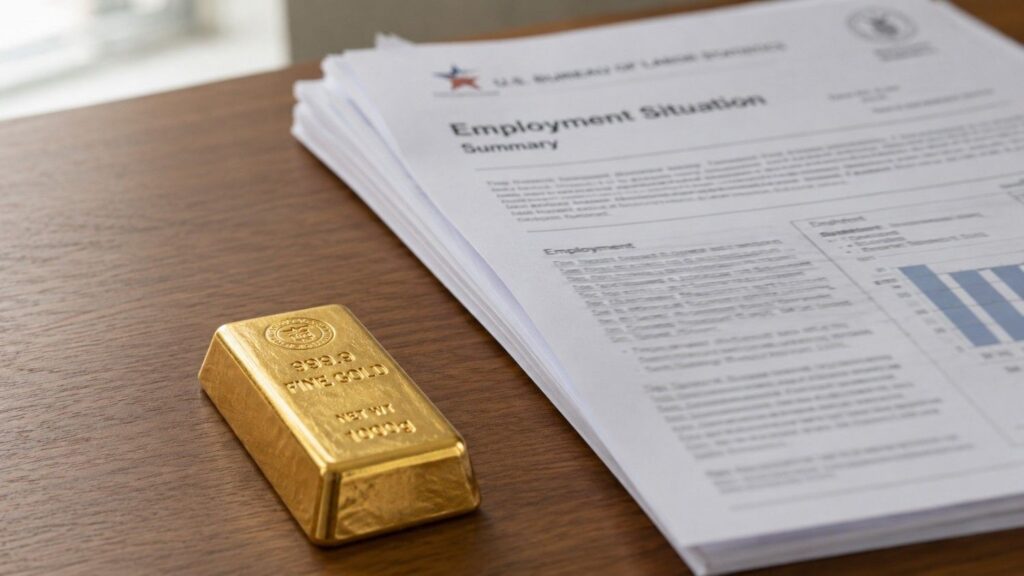
Every month, one government report moves gold’s paper price more than almost anything else. Thursday’s June jobs report is no different. Here’s the mechanism behind the move — and a three-scenario framework for what each outcome means for gold before 8:30 AM ET.
The Dot Plot Has 18 Dots. The Chair Withheld His.

The Fed’s June dot plot had 18 projections, not 19. Chair Warsh withheld his. The split is 9-to-9 — not the hawkish mandate markets have priced into gold.
Gold Is Down Today. The US Market Isn’t Open Yet.

US markets are closed for Juneteenth. The gold price dropping right now is being set by London and Asia — not American investors. Here’s what today’s move means, and what doesn’t
May CPI Printed 4.2%. Core Inflation Beat. So Why Did the Gold Price Drop?

May CPI came in at 4.2% — the fastest pace since early 2023 — and the gold price fell nearly $100 to 11-week lows. But the headline is almost entirely an energy story: gasoline is up 40.5% year-over-year while core CPI rose just 0.2% for the month, below forecast and down sharply from April. The market sold gold on a number it was already expecting. The data behind that number tells a different story.
How Gold Price Is Set: The East-West Tide Explained

For 90 years, gold has moved in a recurring tide between Western financial markets and Eastern physical holders. Understanding who sets the price — and why that mechanism is shifting — is the most useful mental model a gold investor can carry.
Gold Price History: From $35 to $4,500 in 100 Years
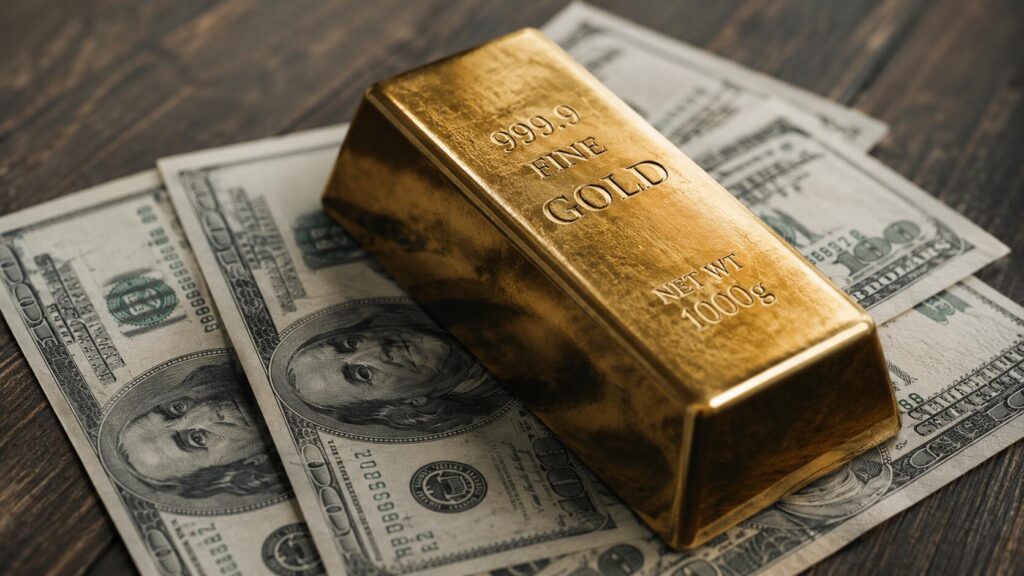
Gold went from $35 in 1971 to around $4,500 today — a 12,000% gain since the gold standard ended. Meanwhile, the dollar lost 96.9% of its purchasing power over the same period. These are not two separate stories. This is the complete gold price history: decade by decade, the real cause behind every major move, and what a century of data tells investors right now.
The Gold Market Is Mostly Paper. Dubai Disagrees.
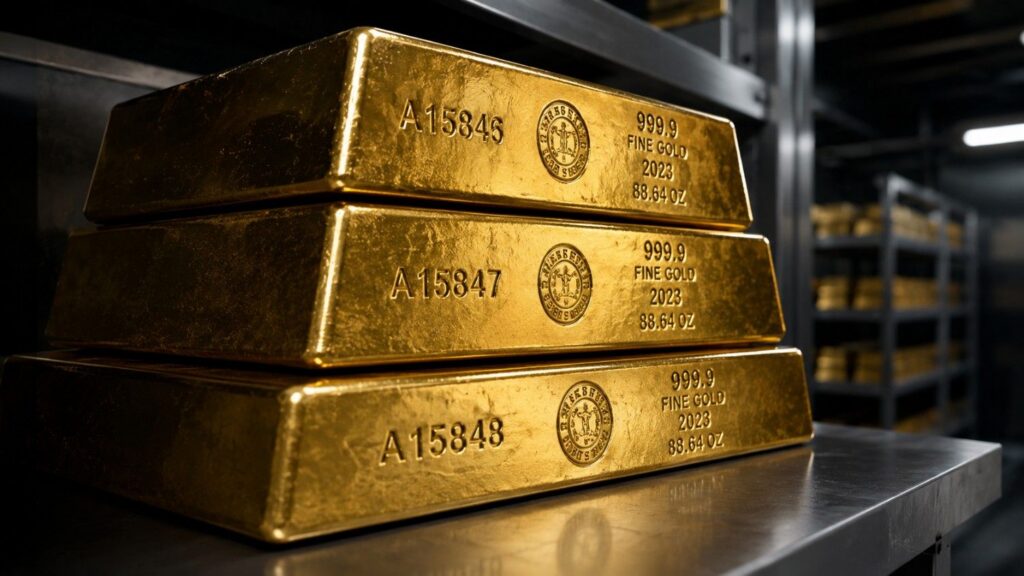
Most gold doesn’t move when it’s “traded” — it changes hands as a ledger entry in an unallocated account. A new report shows Dubai is building a different system entirely, where ownership means a specific bar, not a claim on a pool. Here’s what the difference means for your portfolio.
Why Central Banks Sell Gold — And What It Means for Prices
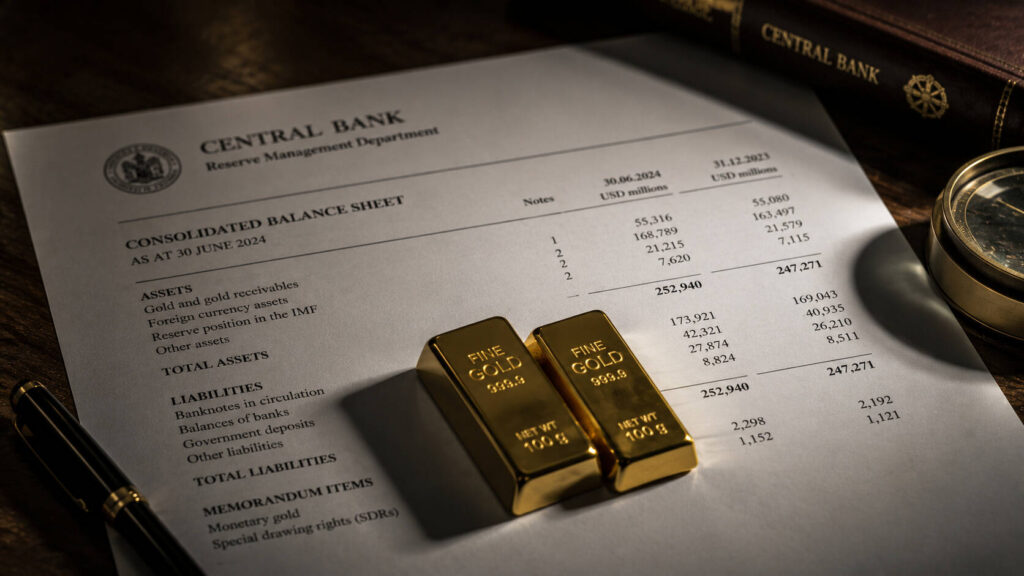
Central banks bought 863 tonnes of gold in 2025. Yet Russia, Turkey, and others are selling. Here’s what drives official-sector gold sales — and what the history of central bank selling tells long-term investors about price risk.


