Published: 06-29-2026, 02:11 pm
A strong jobs report pushes gold’s paper price lower. The mechanism is direct: strong hiring keeps the Federal Reserve on a hawkish path, higher rates raise the cost of holding non-yielding metal, and leveraged futures traders sell first and ask questions later. That’s what’s already happening — gold is $60 lower today, before Thursday’s data even drops.
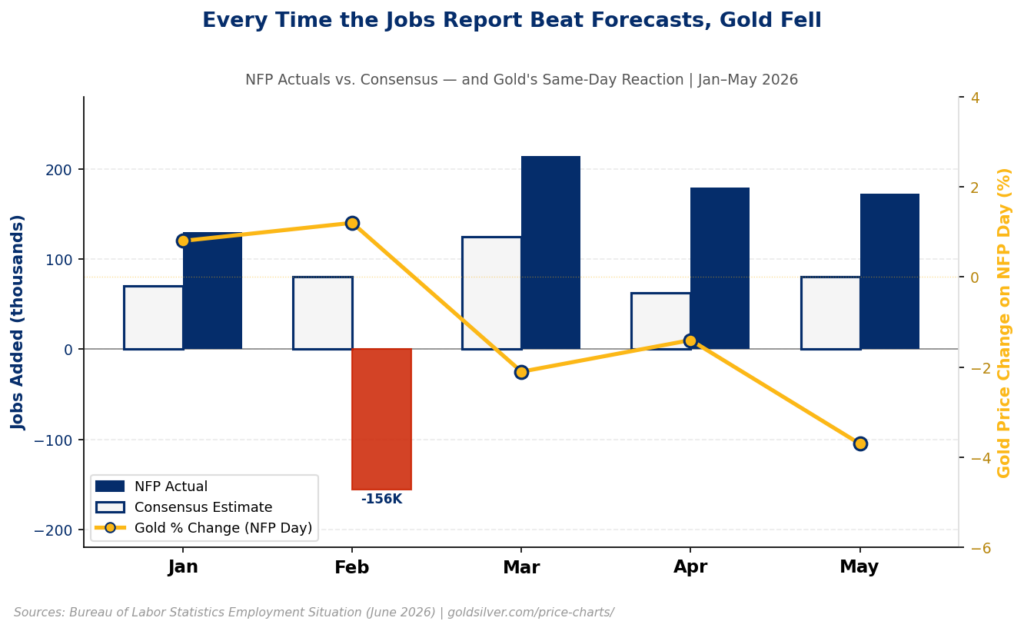
Last month, the Bureau of Labor Statistics reported 172,000 jobs added in May — roughly double what Wall Street expected. Upward revisions made it stronger still: March’s number was bumped to 214,000, April to 179,000. Together, those three months averaged 188,000 — the strongest stretch in more than two years, per Bloomberg’s June 5 analysis of the BLS release. Markets reacted fast. Treasury yields surged. The dollar strengthened. The Nasdaq dropped roughly 4%, its worst single session since April 2025. Gold fell too, because that’s what the mechanism does.
Thursday brings the June jobs report, released a day early ahead of the Independence Day holiday. Wall Street consensus, per Newsquawk’s June 29 week-ahead survey, expects around 115,000 jobs added. That’s below May’s pace, but still well above the level that would prompt the Federal Reserve to change course. Here’s what each outcome means for gold.
What does each scenario mean for gold?
Scenario 1 — Strong beat (150K+). Gold likely drops again on the session. The dollar strengthens. Rate hike expectations for the July 29–30 and September FOMC meetings tick higher. CME FedWatch currently prices the Federal Reserve holding in July at about 70%; a strong print compresses that. Bank forecasts have penciled in up to three rate hikes before year-end. A beat would lock those in.
Scenario 2 — In-line (~100–130K). Limited movement. Gold holds near current levels. Markets continue watching the Doha peace talks Tuesday and Fed Chair Kevin Warsh’s appearance at the ECB Forum on Central Banking in Sintra, Portugal on Wednesday for the next directional signal.
Scenario 3 — Soft miss (below 100K). This is where it gets interesting. A weak print gives the Federal Reserve room to pause. September hike odds compress. The dollar softens. Gold recovers. This is the scenario most people aren’t positioned for — because three consecutive beats have conditioned markets to expect strength.
Why does average hourly earnings matter more than the headline number?
The jobs number gets the headline. However, the mechanism that matters is what that number does to real yields.
When rates rise above inflation, the cost of holding gold goes up. Savers can earn yield in money markets instead. So the argument for non-yielding metal weakens — in theory. That’s the logic traders run.
But there’s another number in every jobs report that rarely makes the headline: average hourly earnings. In May, wages rose 3.4% over the past year, according to the Bureau of Labor Statistics. PCE inflation — the Federal Reserve’s preferred measure, published by the Bureau of Economic Analysis — ran 4.1% over the same period. The result: the BLS Real Earnings release for May confirmed real average hourly earnings fell 0.7% over those twelve months. Workers are earning more dollars and losing ground.
That’s the structural reality no rate cycle can fully solve. The Federal Reserve can raise rates to slow demand. It cannot, however, reduce a $39 trillion national debt — per the US Treasury’s Debt to the Penny dataset as of June 22, 2026 — that generates more than $1 trillion in annual interest payments, per CBO projections for fiscal year 2026. Every rate hike adds to that burden. At some point, the math wins.
What to watch Thursday at 8:30 AM ET
Three numbers will move gold’s price on Thursday:
The headline payroll figure — against a consensus of ~115,000. The deviation from consensus matters more than the absolute number.
Average hourly earnings — a print above 0.3% in a single month would rekindle inflation fears and push rate expectations higher.
The unemployment rate — expected to hold near 4.3%, per the BLS May baseline. Any uptick softens rate hike bets faster than the payroll figure alone.
Gold’s paper price will respond within minutes of the 8:30 ET release. Thursday’s jobs report tells you what rate traders are doing. The central banks buying physical gold on the other side of every rate cycle are already positioned for what comes after.
Stay On Top of Gold & Silver Prices
Get important market alerts sent straight to your inbox.
SOURCES
1. Bureau of Labor Statistics — The Employment Situation, May 2026
2. Bureau of Labor Statistics — Current Employment Statistics (June 2026 release schedule)
3. CME FedWatch via GrowBeanSprout — FOMC Rate Probabilities, June 29, 2026
4. Newsquawk — Week Ahead Highlights, June 29–July 3, 2026
5. IG Markets — Weekly Market Navigator, June 29, 2026
6. US Treasury Fiscal Data — Debt to the Penny
7. GoldSilver — Live Gold & Silver Price Charts
Disclaimer: This article is for informational purposes only and does not constitute financial or investment advice. Always consult a qualified financial adviser before making investment decisions.
You May Also Like:
- The Dot Plot Has 18 Dots. The Chair Withheld His.
- Gold’s Worst Week of 2026. Central Banks Just Filed a Record Buy Signal.
- Silver Looks Like It’s Losing. The Ratio Says It’s Loading.
- Q1 GDP Beat. Jobless Claims Beat. Gold Rose. Here’s Why.
- PCE Hit 4.1%. Gold Went Up. Here’s Why.
- 298 Tonnes of ETF Gold Is Underwater. Central Banks Aren’t.
- Hawkish Fed, Gold Below $4,000, Silver Below $60 — and a Market That Disagrees.