Silver Rises Over 120% YTD


Goldman Just Changed Its Model. Should You Change Yours?
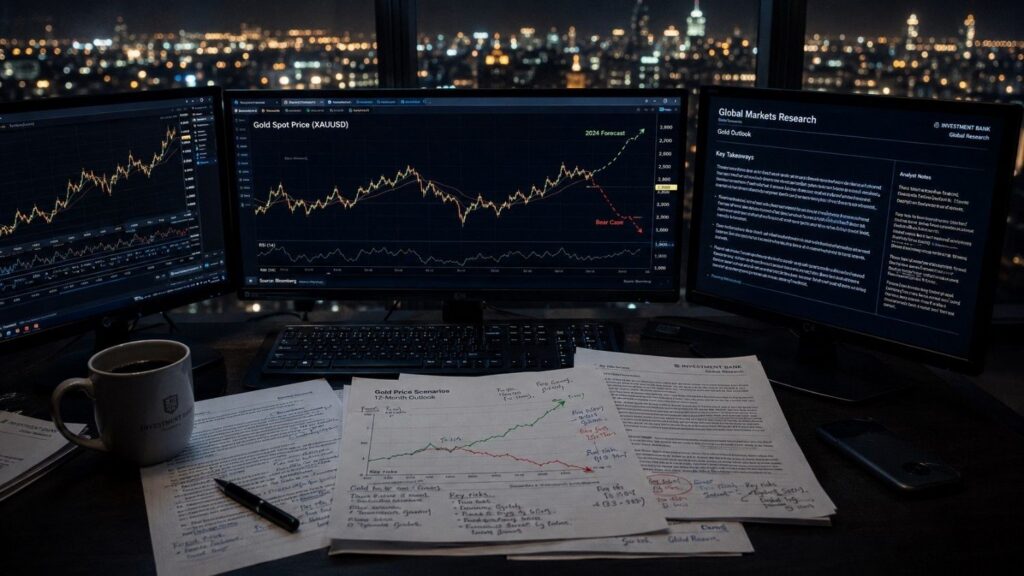
The Goldman Sachs gold cut explained: it’s a valid model output, not a verdict on gold. Here’s how to determine whether Goldman’s framework is your framework, and what data you should actually be watching.
Goldman Cut Its Gold Target. JPMorgan Didn’t. Here’s What the $1,400 Gap Tells You.

Goldman Sachs just cut its year-end gold forecast to $4,900. JPMorgan didn’t move. Neither did Wells Fargo. The $1,400 divergence between the biggest bulls and the biggest skeptic tells you exactly what each bank thinks gold actually is, and why it matters for how you hold it.
Gold Down 26%. Barclays’ $4,791 Target Never Moved.

Barclays held its $4,791 gold target through a 26% correction. Here’s the fair-value framework behind that call — and what it means for gold investors today.
Five Signals That Say Gold’s Correction Is a Reset, Not a Reversal
Gold is down 22% from its January high. But five signals published this week — a record central bank survey, a major bank holding its $4,900 target, and independent research confirming the structural drivers are undamaged — say the correction was positioning, not a thesis break.
Wall Street’s $6,000 gold call rests on data most investors never see
Wall Street’s $6,000 gold forecast isn’t built on the price target — it’s built on a central bank buying figure most investors never see. Official IMF data shows 16 tons of net purchases in Q1 2026. The World Gold Council estimates the real figure at 244 tons. That gap is the story.
Gold at $4,480: Physical Demand Hits a 50-Year Milestone
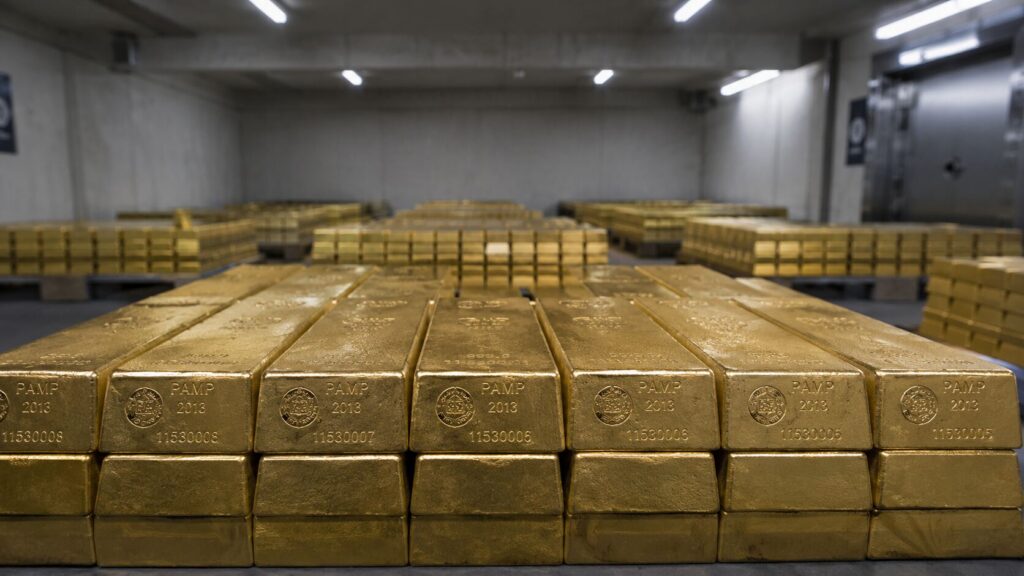
Central banks reshape gold markets through the most concentrated sovereign buying in decades — but that’s only one of five forces moving gold right now. Physical investment is overtaking jewelry demand for the first time on record. Russia’s figures don’t add up. China just hit the brakes. Here’s what’s driving the market.
Gold Surges 1.5%: ADP, ISM, and Beige Book Trap the Fed

Five data points landed Wednesday that should have pressured gold. Instead, gold surged 1.5%. Each event tightens the same Fed trap — and gold trades on the trap, not the direction the Fed falls.
Gold at $4,454 Says the Fed Is Trapped. Here’s Why.
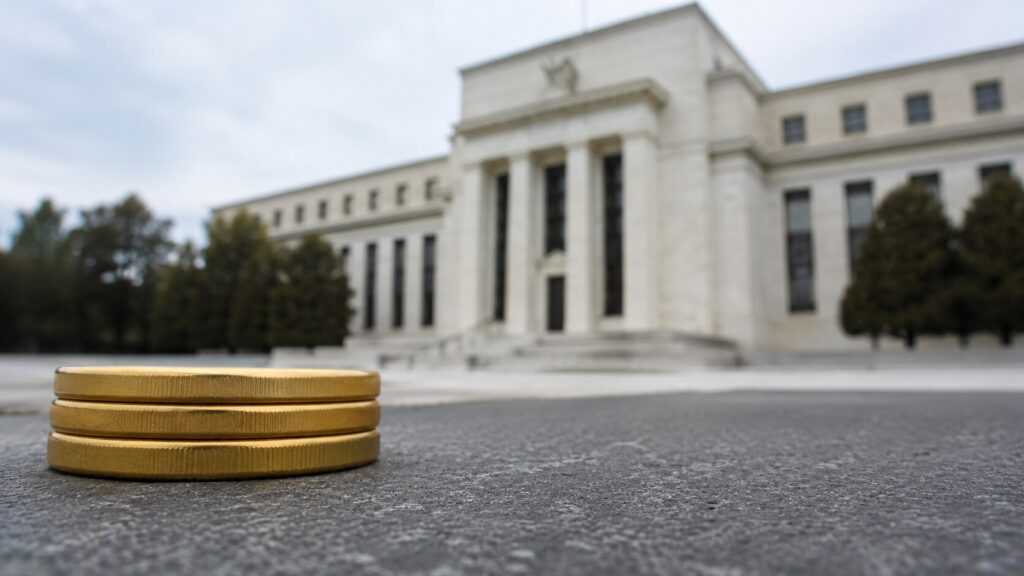
Friday’s jobs report doesn’t just move gold for 48 hours. This time it sets the stage for Kevin Warsh’s first FOMC meeting, a divided committee, and 3.8 percent inflation the Fed can’t cut through. Three scenarios. One structural trap. Here’s the framework before the number drops.
Gold Price History: From $35 to $4,500 in 100 Years
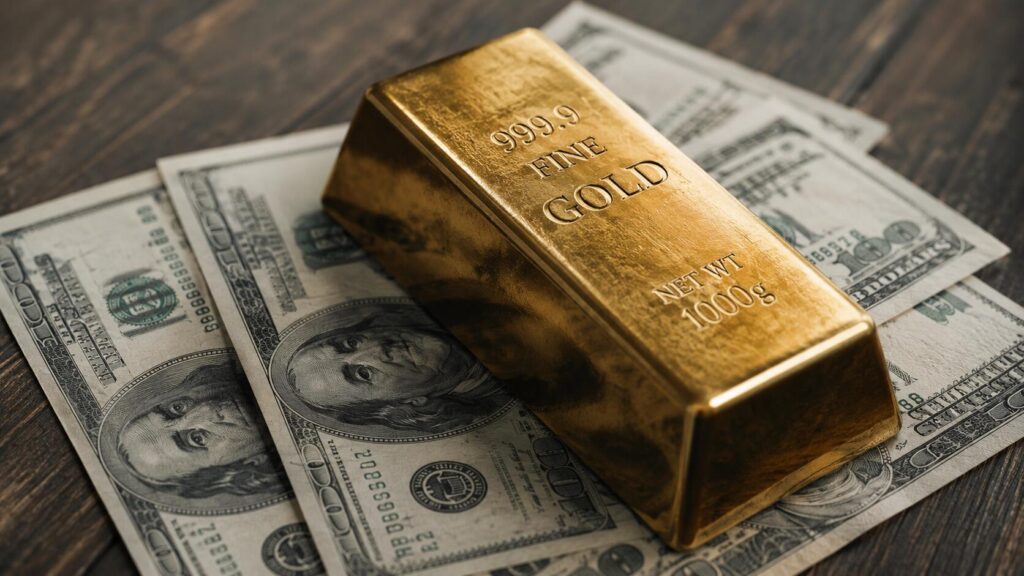
Gold went from $35 in 1971 to around $4,500 today — a 12,000% gain since the gold standard ended. Meanwhile, the dollar lost 96.9% of its purchasing power over the same period. These are not two separate stories. This is the complete gold price history: decade by decade, the real cause behind every major move, and what a century of data tells investors right now.
Gold Targets Are Falling. The $8,000 Forecast Isn’t.

Traders are selling. The institutional buying trend, however, hasn’t moved an inch. Five briefs on what this week’s noise is — and isn’t — telling long-term gold and silver holders.