Published: 06-18-2026, 04:04 pm
Key Takeaways
- The Barclays gold forecast held at $4,791 (2026) and $4,900 (2027) through a 26% correction, naming three temporary causes — none structural [Barclays cross-asset research, June 16, 2026].
- The bank’s fair-value model places gold at $4,150/oz. Current prices (~$4,220) sit just above that floor [goldsilver.com/price-charts/].
- Every 1% increase in inflation delivers ~5% gold upside in Barclays’ model. May 2026 CPI was 4.2% year-over-year [Bureau of Labor Statistics, June 10, 2026].
- Central banks bought 244 net tonnes in Q1 2026. A record 45% plan to add more in the next 12 months [World Gold Council, Q1 2026; 2026 Central Bank Gold Reserves Survey].
- Nine of eighteen FOMC members who submitted projections expect a 2026 rate hike — but Barclays says the inflation driving that view is geopolitical, not structural [Federal Reserve, June 17, 2026].
The Barclays gold forecast for 2026 is $4,791 per ounce, rising to $4,900 in 2027. Crucially, the bank held both targets unchanged through gold’s 26% selloff. Every factor behind the drop, in Barclays’ view, was temporary [Barclays research note, June 16, 2026].
Most institutional forecasts get revised when prices move sharply against them. Barclays didn’t revise. Instead, in a June 16, 2026 note, the bank named three specific causes for the decline, explained why all three will reverse, and held its numbers. The framework behind the Barclays gold forecast matters more than the figure itself.
Barclays places gold’s current fair value at $4,150 per ounce, derived from real interest rates, inflation expectations, and dollar dynamics [Barclays cross-asset research, June 16, 2026]. With gold near $4,220 [goldsilver.com/price-charts/], the metal sits just above that floor. Additionally, the bank’s model quantifies the inflation link directly: each 1% increase in inflation delivers approximately 5% upside to gold. With May 2026 CPI at 4.2% year-over-year — the highest since April 2023 [Bureau of Labor Statistics, June 10, 2026] — that input remains firmly in play. So the $4,791 target reflects a specific expectation: once the Iran-driven energy shock clears, dollar strength fades, and central bank buying resumes, the rebound conditions are all met.
What Did Barclays Actually Publish?
On June 16, 2026, Barclays’ cross-asset research team reviewed gold’s three-month selloff. Their verdict: a positioning reset, not a structural break. Consequently, the 2026 and 2027 targets stayed put [Barclays cross-asset research, June 16, 2026].
Three findings in the note are worth unpacking.
First, Barclays puts gold’s fair value at $4,150. This isn’t a price target. Rather, it’s what the model says gold is worth right now, given real rates, inflation, and the dollar. With gold near $4,220 [goldsilver.com/price-charts/], prices are not a distortion. They’re close to where the math says they should be.
Second, the bank quantifies the inflation-gold link precisely. Each additional percentage point of inflation adds roughly 5% to gold’s price [Barclays cross-asset research, June 16, 2026]. Moreover, May 2026 CPI came in at 4.2% year-over-year — the highest print since April 2023 [Bureau of Labor Statistics, June 10, 2026]. That inflation input is actively supporting the model’s floor.
Third, Barclays names the three causes of the correction and argues that all three are temporary. That argument is the substance of the $4,791 call.
The Knowledge That Changes Everything
Two essential guides — yours free. Understand why gold matters and why fiat currencies always fail.
What Caused the 2026 Gold Selloff?
Barclays traces three causes for gold’s fall from its January record of $5,589 to the June trough near $4,100 [Barclays cross-asset research, June 16, 2026].
First, a materially stronger US dollar — driven by the Iran-conflict oil shock lifting inflation expectations and forcing markets to price out Fed rate cuts. Second, an equity surge that pulled risk capital away from gold. Specifically, the S&P 500’s roughly 10% rally implied approximately a 10% drag on the metal. Third, the unwinding of leveraged gold positions, with Russia and Turkey selling reserves to defend their currencies.
Importantly, none of these are structural. The dollar strengthened because of energy inflation, not because the monetary system changed. Similarly, equity flows defer gold demand — they don’t end it. And leveraged position cleanup, by definition, happens once.
Here is the full chain Barclays traces. The Iran conflict blocked the Strait of Hormuz, pushing oil above $100. As a result, May 2026 CPI hit 4.2% [Bureau of Labor Statistics, June 10, 2026], which forced markets to drop rate-cut expectations and, in some cases, price in hikes. Higher expected rates push nominal yields up. When nominal yields rise faster than inflation expectations, real yields rise. Furthermore, gold moves inversely to real yields. So the entire correction runs through a single mechanism: a geopolitical oil shock translated into real yield pressure.
That chain is now unwinding. The US-Iran memorandum of understanding was signed June 14. Within 30 days, the Strait of Hormuz is set to fully reopen. Oil is falling. Therefore, the real yield pressure that drove the selloff is easing.
How Does Barclays Arrive at a Gold Fair Value?
The Barclays gold forecast rests on a model any investor can interrogate. Its inputs are: the real yield on US Treasuries, the US dollar index, and inflation expectations. Central bank positioning plays a secondary role.
The core logic is straightforward. When real yields turn negative, savers lose purchasing power by holding cash or bonds. This happens when inflation runs ahead of the nominal rate on government bonds. Gold pays no yield. But it doesn’t lose real value to inflation either. In a negative real yield environment, that’s enough to make it attractive. This is financial repression: governments keeping nominal rates below the inflation rate, effectively taxing savers to fund their debt.
Barclays’ $4,150 fair-value estimate is the model’s output given today’s real yield and inflation levels. In other words, the monetary environment justifies $4,150 in structural demand alone, before any geopolitical premium [Barclays cross-asset research, June 16, 2026]. At $4,220 [goldsilver.com/price-charts/], the market is barely above that.
The $4,791 year-end target follows logically from there. If the Iran shock clears, the dollar softens, and rate-cut expectations return, then the model’s inputs improve. That progression gets you from $4,150 to $4,791.
Where Do Other Major Banks Stand?
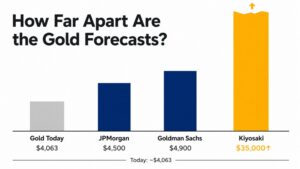
To understand the Barclays gold forecast in context, it helps to see where other major banks stand. At $4,791, Barclays is actually the most cautious bull in the room. Goldman Sachs holds a $5,400 year-end 2026 target. Goldman kept it even after removing all 2026 rate-cut expectations from its economic forecast [Goldman Sachs Commodities Research via Bloomberg, 2026]. That’s a meaningful signal: Goldman’s gold thesis no longer depends on the Fed easing. Meanwhile, J.P. Morgan projects $6,000 per ounce in Q4 2026 [J.P. Morgan Global Research, 2026]. UBS is at $5,600. Bank of America’s 12-month target is $6,000. Wells Fargo’s range is $6,100–$6,300.
In addition, Citi raised its three-month target from $4,000 to $4,500 on June 15, 2026. It also held its six-to-twelve-month target of $5,000. The bank cited the Iran framework as removing the primary inflation driver.
Furthermore, a Reuters poll of 31 analysts puts the 2026 median at $4,916 per ounce [Reuters, 2026].
Gold is currently near $4,220 [goldsilver.com/price-charts/]. Every major bank listed above sees it substantially higher by year-end. Either they are all wrong — or the market is temporarily underpriced.
Major Bank 2026 Gold Price Targets vs. Current Price
Price per troy ounce (USD) — As of June 2026
Source: Bank research via Reuters and Bloomberg | goldsilver.com/price-charts/
Why Central Bank Buying Is the Floor That Doesn’t Move
Barclays expects emerging market central banks to resume buying as geopolitical conditions stabilize [Barclays cross-asset research, June 16, 2026]. During the conflict, some sold reserves to defend their currencies. However, that temporary selling is fundamentally different from a structural shift away from gold.
The data supports this view. Central banks bought 244 net tonnes in Q1 2026 — up 3% from Q1 2025 — even while Turkey and Russia were net sellers [World Gold Council, Gold Demand Trends Q1 2026, April 2026]. In other words, the structural buyers didn’t blink. That’s what a durable floor looks like.
The World Gold Council’s 2026 Central Bank Gold Reserves Survey adds further context. It was conducted across 76 central banks between February and May 2026. The survey found a record 45% of respondents planning to add gold reserves in the next 12 months. Moreover, 89% expect global holdings to rise. Additionally, 74% expect the US dollar’s share of global reserves to fall over the next five years [World Gold Council, 2026 Central Bank Gold Reserves Survey].
Reserve managers don’t take multi-year positions based on a quarter’s price volatility. When 74% of them say the dollar’s reserve share is going lower, they’re expressing a structural institutional view — not a trade. Consequently, that view is what makes the central bank bid durable.
What Does This Forecast Mean If You Hold Physical Gold?
Barclays’ model exposes a relationship worth understanding: gold’s price is tied to the real cost of holding sovereign debt.
Here is the logic. The US national debt stood at approximately $39.3 trillion in mid-June 2026 [US Treasury Fiscal Data, June 2026]. Governments at that debt level need to borrow continuously. When the interest rate on that debt falls short of the inflation rate, real yields go negative. When that persists, savers in cash and bonds lose purchasing power. Gold doesn’t erase that loss — but it doesn’t compound it either.
Barclays’ $4,150 fair value is not a view on politics. It is the model’s read on that structural condition right now. As long as fiscal deficits require ongoing debt issuance and inflation runs above the debt’s yield, the floor exists.
The 2026 correction — from $5,589 to near $4,100 — didn’t break that condition. Instead, it reflected a temporary tightening of real yields driven by an energy shock. Once that disruption clears, the structural case remains intact.
For a broader view of how other institutions frame the same case, see our analysis of major bank gold forecasts for 2026.
Where Does Gold Stand Now?
Two significant events resolved in the past week. Both are relevant to where the Barclays gold forecast goes from here. First, the US-Iran memorandum of understanding was signed June 14, 2026, opening a 60-day negotiation window and a 30-day timeline to fully reopen the Strait of Hormuz. Second, oil has shed roughly 25% from its conflict peak.
At the same time, the Federal Reserve held rates at 3.50–3.75% at the June 16–17 meeting — the fourth consecutive hold [Federal Reserve, FOMC Statement, June 17, 2026]. However, the bigger story was the dot plot. Nine of the eighteen officials who submitted projections now expect at least one rate hike in 2026. Notably, Chair Warsh did not submit a forecast. He cited his opposition to forward guidance [Federal Reserve, Summary of Economic Projections, June 17, 2026]. Gold fell roughly 2% on the hawkish signal, and short-term yields surged.
That pressure is real and should not be dismissed. A Fed hiking cycle would push real yields higher — exactly the headwind the Barclays gold forecast is most sensitive to. The question is whether Warsh’s hawkish lean is durable, or a direct response to energy-driven inflation that is already easing as Hormuz reopens.
Barclays’ read, as of June 16, is the latter. Inflation forcing the Fed’s hand was geopolitical in origin. Oil is falling. And the thesis stands.
Gold sits near $4,220 per ounce as of June 19, 2026 [goldsilver.com/price-charts/].
Stay On Top of Gold & Silver Prices
Get important market alerts sent straight to your inbox.
People Also Ask
What is Barclays’ gold price forecast for 2026?
The Barclays gold forecast for 2026 is $4,791 per ounce, rising to $4,900 in 2027. Both targets come from a June 16, 2026 research note by the bank’s cross-asset team [Barclays cross-asset research, June 16, 2026]. Barclays held the Barclays gold forecast unchanged after gold’s roughly 26% correction from its January 28, 2026 all-time high of $5,589 — concluding the selloff was a positioning reset rather than a structural reversal.
What is Barclays’ fair value estimate for gold?
The Barclays gold forecast is built on a fair-value model, not just a price target. Barclays calculates that fair value at approximately $4,150 per ounce as of mid-2026, based on current real interest rates, inflation expectations, and dollar dynamics [Barclays cross-asset research, June 16, 2026]. With gold near $4,220 [goldsilver.com/price-charts/], current prices are close to — but modestly above — what the monetary environment structurally supports.
Why did Barclays keep its gold forecast after the 2026 correction?
The Barclays gold forecast survived the 2026 correction because the bank named three causes — and all three are self-reversing. Those causes were: a stronger dollar from Iran-driven energy inflation, equity markets drawing risk capital away from gold, and the unwinding of leveraged positions including reserve sales by Russia and Turkey [Barclays cross-asset research, June 16, 2026]. None changed gold’s structural case — fiscal deficits, monetary expansion, and ongoing central bank reserve diversification. So the targets stayed unchanged.
What are other major banks forecasting for gold in 2026?
Compared to the Barclays gold forecast of $4,791, most major banks are significantly more bullish. Goldman Sachs holds a $5,400 year-end 2026 target [Goldman Sachs Commodities Research via Bloomberg, 2026]. J.P. Morgan projects $6,000 by Q4 2026 [J.P. Morgan Global Research, 2026]. UBS is at $5,600. Bank of America’s 12-month target is $6,000. Wells Fargo’s range is $6,100–$6,300. Citi’s 6–12 month target is $5,000. Additionally, a Reuters poll of 31 analysts produced a 2026 median of $4,916 [Reuters, 2026]. By comparison, Barclays at $4,791 is the most conservative of the group.
What is the relationship between real yields and gold prices?
Gold moves inversely to real yields — the inflation-adjusted return on government bonds. When real yields turn negative, meaning inflation exceeds the nominal rate on savings, gold becomes relatively attractive. It pays nothing, but it doesn’t lose real value to inflation. Rising real yields, as occurred during gold’s 2026 correction, raise the opportunity cost of holding a non-yielding asset. Specifically, the Iran conflict drove that mechanism: energy inflation suppressed rate-cut expectations, pushed nominal yields up, and elevated real yields. However, each of those forces is now easing as the conflict resolves and oil retreats.
SOURCES
1. CNBC — Gold Sell-Off Was a ‘Reset,’ Says Barclays
2. Bureau of Labor Statistics — Consumer Price Index Summary, May 2026
3. World Gold Council — Gold Demand Trends Q1 2026
4. World Gold Council — 2026 Central Bank Gold Reserves Survey
5. Federal Reserve — FOMC Meeting Statement, June 17, 2026
6. Federal Reserve — Summary of Economic Projections (Dot Plot), June 17, 2026
7. J.P. Morgan Global Research — Gold Price Predictions 2026 and 2027
8. Goldman Sachs Commodities Research — 2026 Gold Price Target ($5,400), via Bloomberg
9. Reuters — Poll of 31 Analysts, 2026 Gold Price Median Forecast (~$4,916/oz)
10. US Treasury Fiscal Data — Debt to the Penny
11. GoldSilver — Live Gold and Silver Price Charts
Disclaimer: This article is for informational purposes only and does not constitute financial or investment advice. Always consult a qualified financial adviser before making investment decisions.
You may also like:
- Gold Silver Ratio at 64: What It Signals for Silver in 2026
- How Central Banks Decide How Much Gold to Hold
- How Much Does Gold Storage Cost? The $72-a-Year Answer
- Silver Price Outlook June 2026: The Correction Was the Setup
- Wall Street’s $6,000 gold call rests on data most investors never see
- Silver Eagle vs. Maple Leaf vs. Britannia: Which Gives You More Silver?
- Gold Price Outlook June 2026: What CPI and the Fed Mean
- How Gold Price Is Set: The East-West Tide Explained
- Does Physical Gold Have Counterparty Risk? The Facts