Published: 06-12-2026, 02:58 pm | Updated: 06-15-2026, 08:32 am
J.P. Morgan projects gold near $6,000 by year-end. The forecast isn’t built on the $6,000 number — it’s built on a central bank buying figure that official reports understate by a factor of 15.
J.P. Morgan Global Research projects gold will approach $6,000 per ounce by Q4 2026 and $6,300 per ounce by end-2027. The bank’s revised full-year 2026 average forecast is $5,243. Gold trades at $4,216 today. The forecast is driven by central bank demand that official IMF-reported data understates significantly — the World Gold Council estimates actual Q1 2026 central bank purchases at 244 tons, against just 16 tons in official net-purchase reports. China’s role, both through the People’s Bank of China and its insurance sector, is the structural factor most investors are not tracking.
Key takeaways
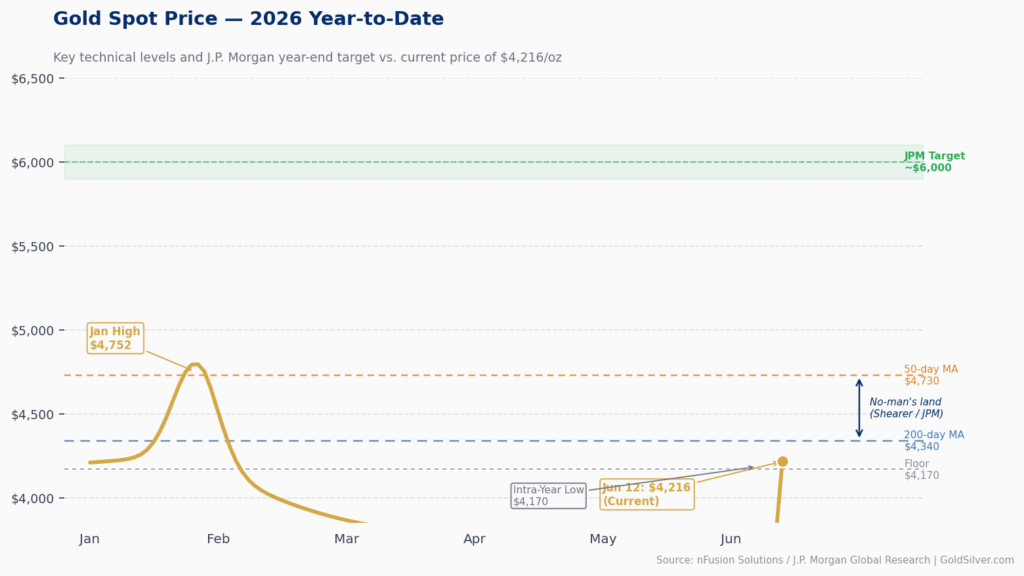
- Gold trades at $4,216/oz today — 12% below its January all-time high of ~$4,752. J.P. Morgan’s year-end target implies a further 42% move from here.
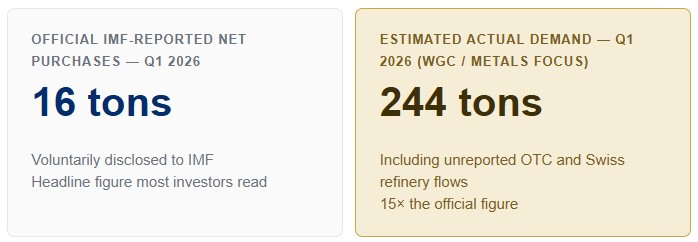
- Official Q1 2026 central bank net purchases: 16 tons. World Gold Council estimated actual demand: 244 tons. The gap exists because IMF reporting is not mandatory.
- China’s PBOC ramped disclosed buying from ~1 ton/month to 8 tons in April 2026. Chinese net gold imports hit 317 tons in Q1 — nearly triple the prior quarter.
- Ten major Chinese insurance companies now hold regulatory approval to allocate up to 1% of assets to physical gold — roughly 200 tons of potential demand at current prices.
- The primary downside risk is a Fed hiking cycle driven by energy-led inflation. That scenario would compress Western ETF demand and weigh on prices.
What is the real data behind the $6,000 gold price forecast?
Central bank gold purchases in 2026 are running at roughly 15 times the official reported figure — and that gap is what Wall Street’s $6,000 gold forecast is actually built on.
They’re watching $6,000 — J.P. Morgan’s year-end price target, which has circulated widely and landed in countless portfolio reviews. It’s the number that generates the headlines. It’s also, in a meaningful sense, not the number that matters.
The number that matters is 244. As in 244 tons — the World Gold Council’s estimate of actual central bank gold purchases in the first quarter of 2026. Compare that to the 16 tons that showed up in official IMF-reported data for the same period. The gap between those two figures — a factor of roughly 15 — is what the J.P. Morgan forecast is actually built on. And most investors have never seen it.
What is J.P. Morgan’s gold forecast for 2026 — and what drives it?
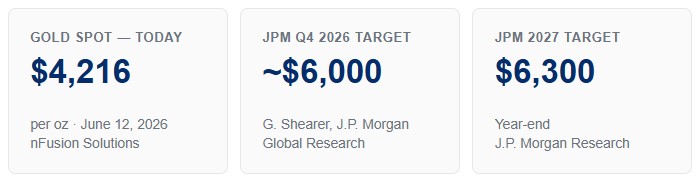
J.P. Morgan Global Research projects gold will approach $6,000 per ounce by Q4 2026, rising toward $6,300 by year-end 2027. The bank’s revised full-year 2026 average forecast is $5,243 — a downgrade from a prior estimate of $5,708, reflecting softer near-term investor participation and lighter ETF positioning.
Gregory Shearer, Head of Base and Precious Metals Strategy at J.P. Morgan, described the current market dynamic in terms that are useful precisely because they’re honest:
“Gold is stuck in a bit of a technical no-man’s land, trudging above the 200-day moving average around $4,340 per ounce and capped for now below the 50-day moving average at $4,730 per ounce. Amid this sideways plod, and with growing worries that the Fed might have to respond to energy-driven inflation with hikes, gold is on the back burner for most investors at the moment.”
— Gregory Shearer, Head of Base & Precious Metals Strategy, J.P. Morgan
J.P. Morgan is not alone. Goldman Sachs projects a year-end price of $5,400. Wells Fargo has cited $8,000 as a 2027 possibility. A Reuters survey of 31 analysts published in April 2026 placed the median forecast at $4,916. The directional consensus is meaningfully above today’s $4,216.
But the more important question isn’t what Wall Street is forecasting. It’s what they’re forecasting based on — and why that underlying data is largely invisible to retail investors.
The Knowledge That Changes Everything
Two essential guides — yours free. Understand why gold matters and why fiat currencies always fail.
Are central banks still buying gold? The official answer and the real one
On the surface, Q1 2026 central bank data looks weak. Official IMF-reported net purchases came in at 16 tons. Central banks sold a gross 129 tons during the quarter, with Turkey alone selling 60 tons in March. Read those numbers and the conclusion seems obvious: institutional buying has cooled.
The conclusion is wrong. What has cooled is the pace of reported buying. The actual buying is a different story.
The World Gold Council, using data from the London over-the-counter market and Swiss refinery trade flows, estimates that total central bank gold demand in Q1 2026 reached 244 tons — up from 208 tons in Q4 2025. The discrepancy exists because there is no mandatory rule requiring countries to report gold purchases to the International Monetary Fund. A meaningful and consistent portion of buying goes unreported every quarter.
That gap — 16 tons vs. 244 tons — is not an anomaly. It reflects a structural feature of the gold market: sovereign buyers are under no obligation to disclose their accumulation, and many choose not to. The World Gold Council’s OTC methodology exists precisely to capture what voluntary disclosure misses.
Why is China buying so much gold — and who is doing the buying?
At least one of the large unreported buyers appears to be China. Chinese net gold imports hit 317 tons in Q1 2026 — nearly three times the prior quarter’s pace. The People’s Bank of China simultaneously accelerated its disclosed buying, from approximately one ton per month through February to five tons in March and eight tons in April.
The motivation is strategic. When the United States froze Russian central bank assets in 2022, it sent a signal to every government holding dollar-denominated reserves: those holdings are conditionally safe. China read that signal and has been systematically diversifying toward an asset that cannot be frozen, sanctioned, or debased. Physical gold held outside the dollar system is the clearest expression of that strategy.
The central bank is not the only major Chinese buyer that has entered the market. In February 2025, China’s National Financial Regulatory Administration issued a notice permitting ten major insurance companies — including China Life, PICC Property & Casualty, and Ping An Life Insurance — to allocate up to 1% of their assets under management to physical gold. The companies completed their first transactions on the Shanghai Gold Exchange in March 2025.
At 1% of combined assets, the allocation potential amounts to approximately 200 tons. Bank of America estimates the policy could create 300 tons of additional annual demand — roughly 6.5% of the global market. Industry analysts believe 1% is a starting point. These companies are not yet required to disclose their holdings. When they begin to do so, the market may discover that institutional accumulation has proceeded further than any public figure suggests.
What are the risks to gold’s price outlook in 2026?
Gold has a structural vulnerability that institutional forecasters acknowledge directly. Because it produces no yield, it tends to underperform when the real return on competing assets — particularly US Treasuries and money market funds — rises.
Shearer named the specific scenario: a macro environment where US growth and employment remain strong but inflation continues to accelerate, forcing the Federal Reserve into a rate-hiking cycle. That outcome would push real yields higher and likely trigger sustained outflows from Western gold ETFs — which J.P. Morgan has already revised from a 580-ton to a 400-ton inflow forecast for 2026.
“The most significant bearish risk to our view is a macro scenario where U.S. growth and employment remain buoyant but inflation continues to accelerate, solidifying a Fed hiking cycle this year,” Shearer said. “A Fed that feels emboldened by stronger employment momentum and crystallizes behind a need to fight higher for longer inflation could begin to crack investor demand.”
The Iran-Israel-US conflict adds a different kind of complexity. Resolution would remove some tail risk supporting gold — but Shearer noted that the conflict’s trajectory has also reinforced the structural themes driving demand: higher inflation expectations, US fiscal concerns, and growing uncertainty about the predictability of US foreign policy. The geopolitical premium is a recent addition to a structure that was already in place.
What gold’s sideways move is actually telling you
Gold’s current range — roughly $4,170 to $4,730 — is not indecision. It is absorption.
The market is absorbing Turkey’s 60-ton sale. It is absorbing reduced Western ETF inflows. It is absorbing the repricing risk of a potentially more hawkish Fed. And it is holding.
In prior cycles, a combination of emerging-market central bank selling, slowing ETF demand, and geopolitical uncertainty would have sent gold down 15–20% from its peak. The correction from January’s high to June’s floor is approximately 12%. That is a smaller drawdown than the fundamental headwinds would historically have produced.
The structure underneath has changed. Central banks bought an average of 225 tons per quarter from 2021 through 2025 — double the pace of the preceding five-year period. China’s insurance sector is now a structural buyer. The 2022 Russian asset freeze created a permanent incentive for sovereign diversification away from dollar assets. These are not trading positions. They do not reverse on a Fed minutes release or a cooler CPI print.
What the consolidation signals is that the buyers who matter most — central banks, sovereign institutions, long-duration allocators — are using the pause to accumulate, not to exit. The sideways price is not evidence that they’ve stopped. It’s evidence that they’ve absorbed the selling and the price has held.
What should gold investors watch for the rest of 2026?
Fed policy signals matter more than the gold price itself in the near term. Any signal of rate hikes — particularly in response to energy-driven inflation — would compress investor sentiment and likely trigger ETF outflows. Watch the Fed’s language at each upcoming FOMC meeting.
The PBOC’s monthly disclosure schedule is also worth tracking. The acceleration from approximately one ton per month to eight tons in April represents a meaningful pace change. If China’s disclosed buying continues near that level, it establishes a structural floor under prices that does not depend on Western investor participation.
Finally, watch for the first public disclosures from China’s insurance companies. They are not yet required to report their gold holdings. When they begin doing so, the market may find that the structural accumulation has proceeded considerably further than any currently visible data point suggests.
The case for gold through the rest of 2026 does not rest on a single catalyst. It rests on the slow, steady accumulation of demand by buyers who are not trading. They are holding. The $6,000 forecast is not a guess — it is a flow model built on that reality. Understanding what is actually flowing, and why so little of it is officially reported, is what the number requires to make sense.
Stay On Top of Gold & Silver Prices
Get important market alerts sent straight to your inbox.
People Also Ask
What is J.P. Morgan’s gold price forecast for 2026?
J.P. Morgan projects gold will approach $6,000 per ounce by Q4 2026 and $6,300 by year-end 2027. The bank’s revised full-year 2026 average forecast is $5,243 per ounce, lowered from $5,708 due to softer near-term investor demand and reduced ETF inflow expectations. Gold trades at $4,216 as of June 12, 2026.
Are central banks still buying gold in 2026?
Yes — but the official data significantly understates the volume. IMF-reported net central bank purchases were 16 tons in Q1 2026. The World Gold Council, using OTC market and Swiss refinery data, estimates actual total demand reached 244 tons in the same quarter — approximately 15 times the official figure. Reporting to the IMF is voluntary, so a consistent portion of sovereign buying goes unreported.
Why is China buying so much gold?
China’s gold accumulation is primarily a strategic hedge against dollar-asset risk. The US freezing of Russian central bank reserves in 2022 demonstrated that dollar-denominated holdings can be restricted by US sanctions. China appears to be systematically building gold reserves as a non-sanctionable, non-debasing alternative. The People’s Bank of China accelerated disclosed purchases from roughly one ton per month to eight tons in April 2026, while net Chinese gold imports hit 317 tons in Q1.
What is the biggest risk to gold prices in 2026?
According to J.P. Morgan’s Gregory Shearer, the biggest risk is a scenario where strong US employment and energy-driven inflation force the Federal Reserve into a rate-hiking cycle. Higher real yields would make yield-bearing assets more competitive relative to gold, likely triggering sustained outflows from Western gold ETFs and creating a persistent headwind for prices.
Why does official central bank gold data understate actual buying?
There is no mandatory requirement for central banks to report gold purchases to the International Monetary Fund. Reporting is voluntary, and many sovereign buyers — particularly those pursuing strategic diversification away from dollar assets — choose not to disclose purchases promptly, if at all. The World Gold Council estimates total demand using alternative data sources including the London OTC market and Swiss refinery trade flows, which consistently show higher volumes than official figures.
SOURCES
1. J.P. Morgan Global Research — Gold Price Predictions for 2026 and 2027
2. World Gold Council — Gold Demand Trends Q1 2026: Central Banks
3. Goldman Sachs Global Investment Research — Still Bullish Gold, February 2026
4. Reuters — Gold Price Analyst Survey, April 2026 (31 analysts, median forecast $4,916/oz)
5. ICE Benchmark Administration — LBMA Gold Price
6. National Financial Regulatory Administration of China — Pilot Program for Insurance Funds to Invest in Gold, February 7, 2025
7. Bank of America Global Research — China Insurance Sector Gold Demand Estimate, March 2025
Disclaimer: This article is for informational purposes only and does not constitute financial or investment advice. Always consult a qualified financial adviser before making investment decisions.
You may also like:
- Silver Eagle vs. Maple Leaf vs. Britannia: Which Gives You More Silver?
- Gold Price Outlook June 2026: What CPI and the Fed Mean
- How Gold Price Is Set: The East-West Tide Explained
- Does Physical Gold Have Counterparty Risk? The Facts
- Why Is Gold Still a Safe Haven? Switzerland’s Biggest Refiner Just Answered.
- Rate Hike Odds Just Hit 85%. Gold Is Up. Here’s Why.
- Gold Confiscation: Could the Government Take Your Gold Again?
- Gold Price History: From $35 to $4,500 in 100 Years
- The Debasement Trade Explained: Mechanism, History, and What It Means for Gold