 Silver Rises Over 120% YTD




Gold Technical Analysis: A Complete Investor’s Guide
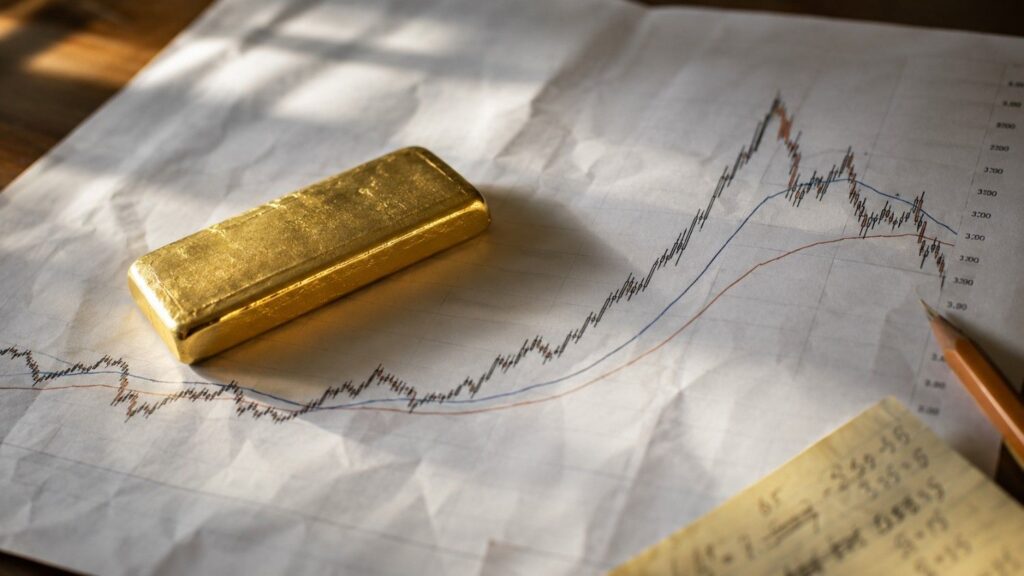
Gold technical analysis explains how moving averages, RSI, MACD, and Fibonacci retracement levels work — and how long-term physical holders can use them to size positions and time entries more intelligently.
Gold Hits 3-Week High as Fed Hike Odds Halve on Jobs Miss
June’s jobs report added just 57,000 positions — less than half the forecast. Fed rate hike odds for July 29 fell to 22%. Gold hit a 3-week high. Here’s the mechanism.
The Jobs Report Missed. The Unemployment Rate Fell Anyway. Gold Didn’t Buy It.

Gold and silver rose after June’s jobs report missed and unemployment fell to 4.2%, but only because labor force participation dropped to a five-year low, not stronger hiring.
Warsh Called Inflation “Too High.” He Also Said the Risk Is Fading. Gold Noticed.

Gold and silver jumped Wednesday after Fed Chair Kevin Warsh softened his hawkish tone at the ECB’s Sintra forum — a shift that matters more than the day’s ADP miss. Here’s the real-yield mechanism behind the move, and why Thursday’s early jobs report is now the number to watch.
Garner Calls a $3,600 Floor. Is Gold Going Lower?

Gold hit an all-time high of $5,589 on January 28, 2026. It is trading around $4,024 today. A new Fed Chair is explicitly trying to reverse the monetary policy trend that drove it there. Here is whether that changes anything for long-term holders.
Mining Margins Beat Google’s. Here’s What That Tells You About Gold.

At $4,000 gold and $60 silver, the companies pulling this metal out of the ground are generating margins that rival the most profitable technology businesses on earth. Precious metals investor Tavi Costa explains the mechanism — and what it means for long-term owners of physical gold and silver.
Gold Is Closing Its Worst Quarter Since 2013. A War Made It Happen.
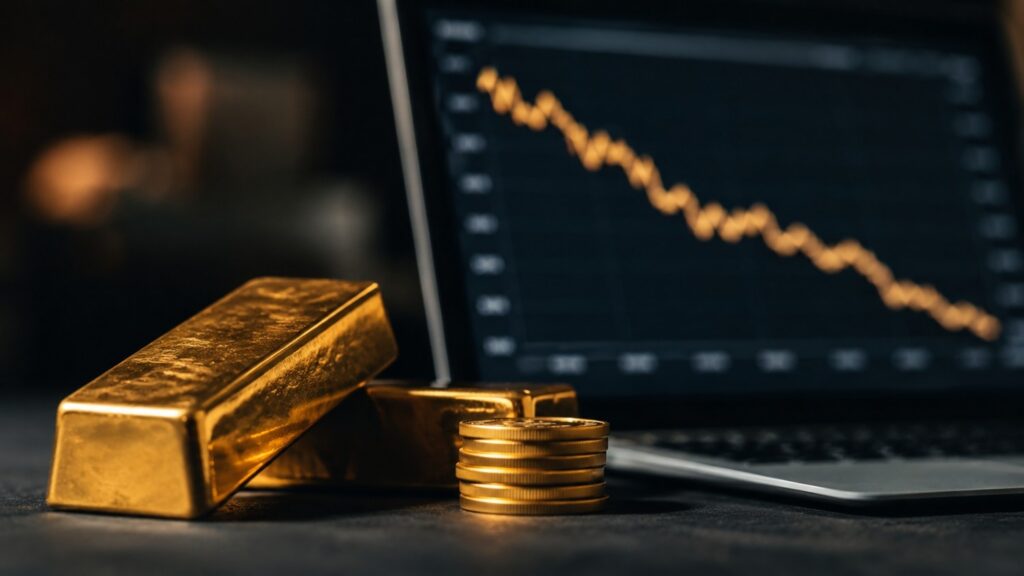
Gold entered Q2 at around $4,700. It is leaving at $4,015. That is the worst quarterly decline since the 2013 taper tantrum — and the cause is a war, not despite one.
Why Is Gold So Expensive? The 5 Mechanisms Behind the Price
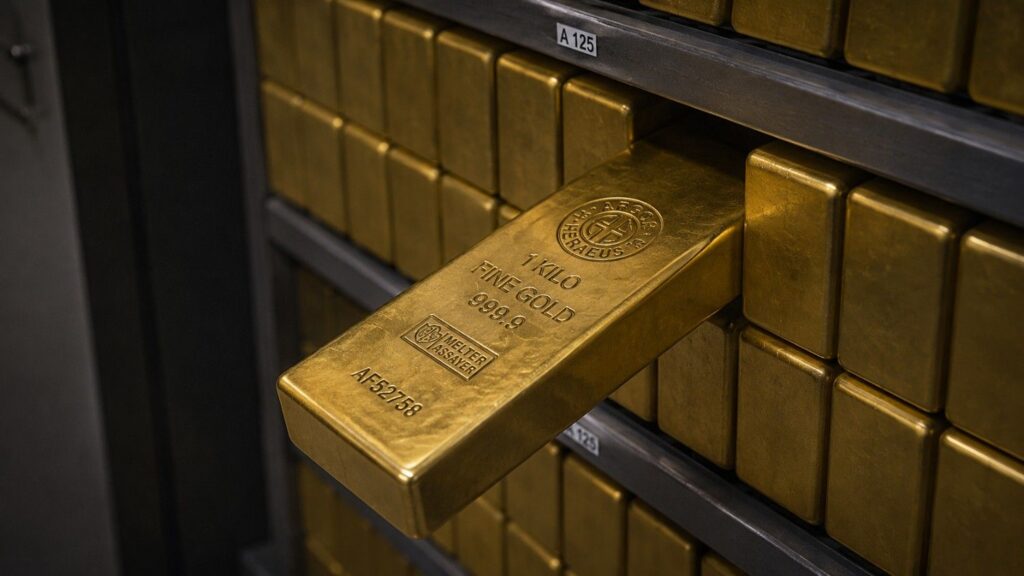
Gold costs roughly $4,000 per ounce today. Here are the five specific, measurable forces that explain exactly why — and why every major bank expects the price to go higher.
172,000 Jobs Doubled the Forecast. Thursday’s Report Could Move Gold Again.
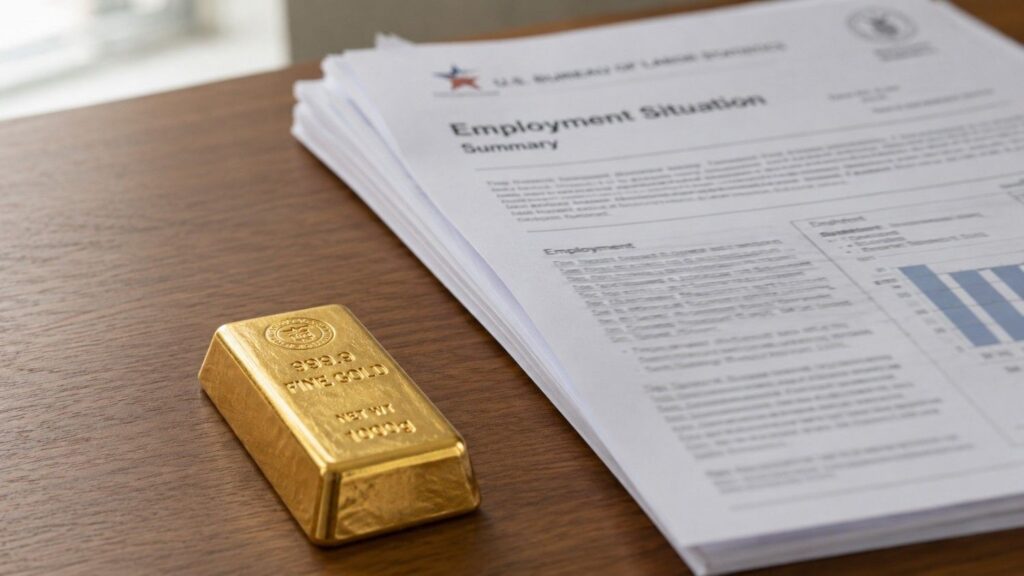
Every month, one government report moves gold’s paper price more than almost anything else. Thursday’s June jobs report is no different. Here’s the mechanism behind the move — and a three-scenario framework for what each outcome means for gold before 8:30 AM ET.
The Dot Plot Has 18 Dots. The Chair Withheld His.

The Fed’s June dot plot had 18 projections, not 19. Chair Warsh withheld his. The split is 9-to-9 — not the hawkish mandate markets have priced into gold.


