The Canadian Gold Maple Leaf: Purer Than the Eagle, Lower Premium, and IRA-Eligible
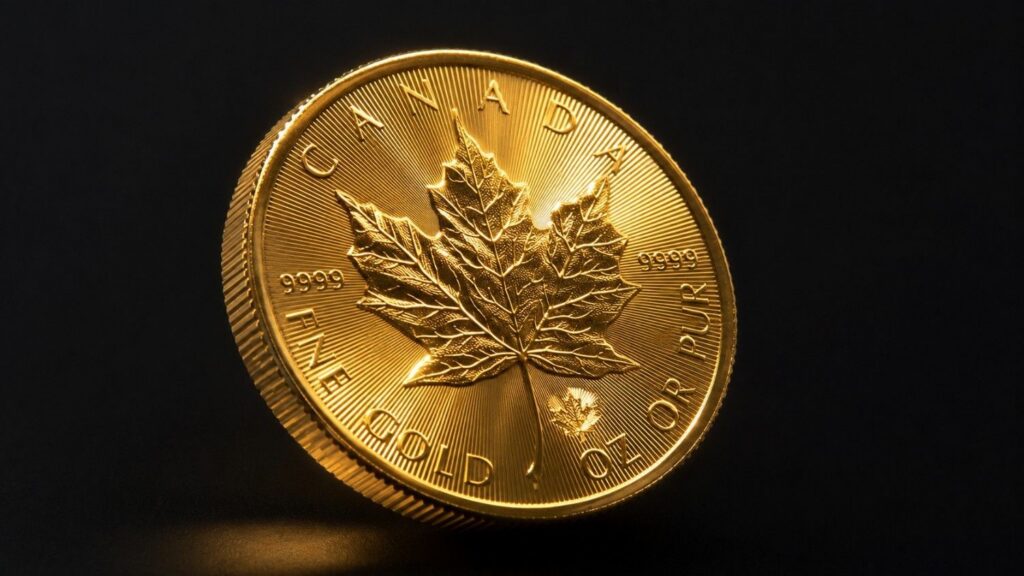
The Canadian Gold Maple Leaf is 99.99% pure gold, carries a lower dealer premium than the American Gold Eagle, and qualifies for a Gold IRA without a congressional exemption. Here is what the purity standard, security features, sizing options, and sound money case look like for investors considering physical gold ownership.
Gold’s 27% Drawdown Matches 2008 and COVID Almost Exactly. That’s Not a Warning.

Gold has fallen roughly 27% from its January 2026 high — almost identical to its drawdown in 2008 and during COVID. Both of those corrections resolved to significant new highs. Jeff Clark breaks down what history says comes next, why central bank buying hasn’t slowed, and the third historical parallel that makes this moment even more precise than either prior comparison.
American Gold Eagle Coin: The Complete Investor Guide
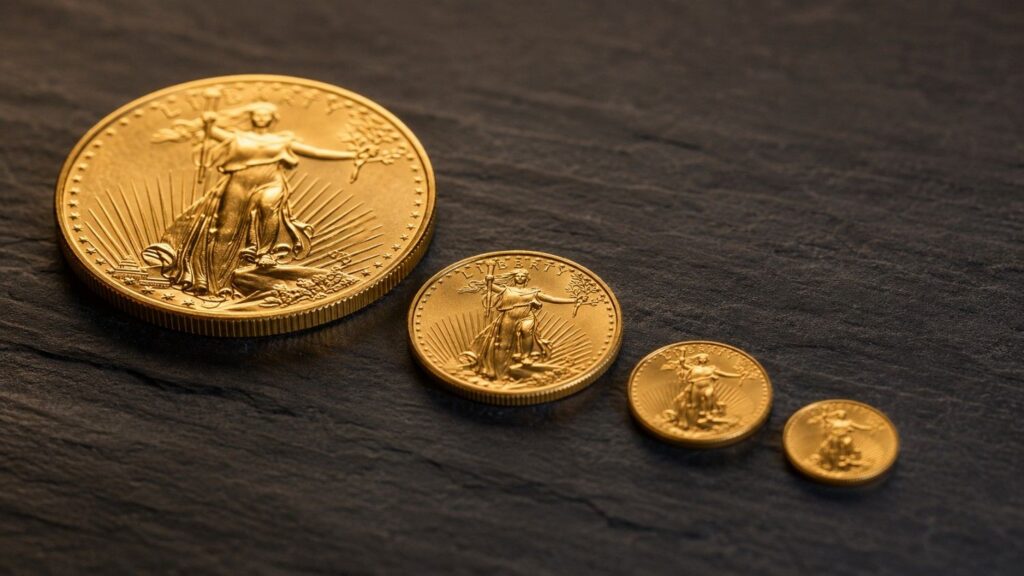
The American Gold Eagle is the official gold bullion coin of the United States — available in four sizes, IRA eligible by a special Congressional exemption no other 22-karat coin holds, and backed by the US government for weight and purity. This guide covers composition, sizes, premium structure, liquidity, and how to choose between bullion and proof.
What Is a Gold-Backed Stablecoin? How One Private Buyer Changed the Gold Market

Since Q2 2025, one private company has been buying physical gold at a pace that has outrun almost every central bank on earth. Its name is Tether. Here is how a gold-backed stablecoin works, why its buying is price-insensitive by design, and what it means for gold demand — plus the full Adrian Day interview.
Kiyosaki Gold Prediction: Buy the Dip or Wait?
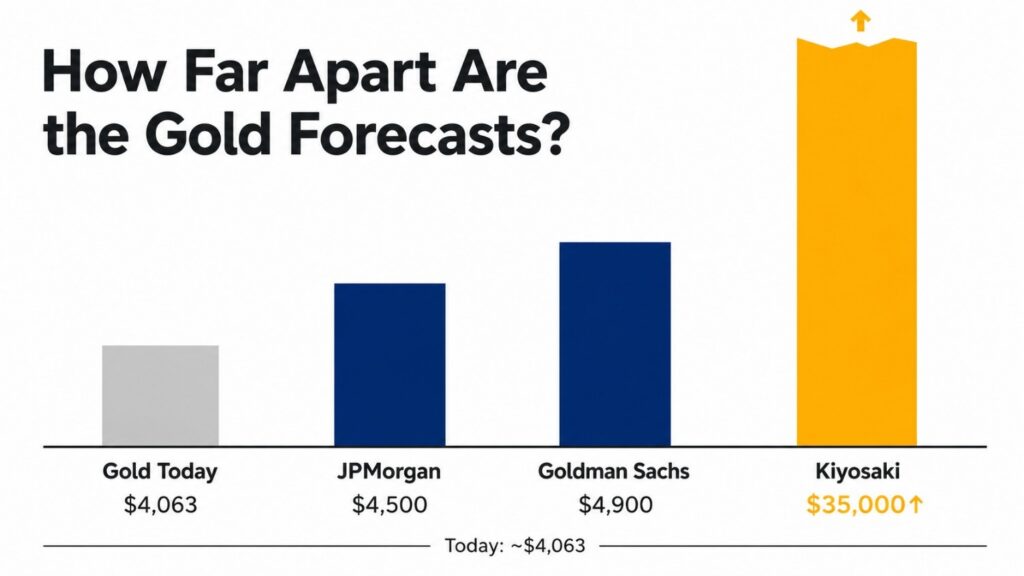
Robert Kiyosaki predicts $35,000 gold after a systemic collapse. Goldman Sachs targets $4,900. JPMorgan targets $4,500. Gold trades at $4,063 today — 27% below its all-time high. Here’s what the structural data says about buying the dip or waiting.
Gold Risk-Reward Calculator: Is Your Portfolio Actually Safe?

Most investors think a diversified portfolio means they are protected. The 2022 data says otherwise. Here is the historical framework — Sharpe ratios, crisis performance across six major market shocks, and gold’s correlation data — for assessing whether your portfolio is actually safe.
What Are the Best Physical Precious Metals Products to Buy During a Correction?
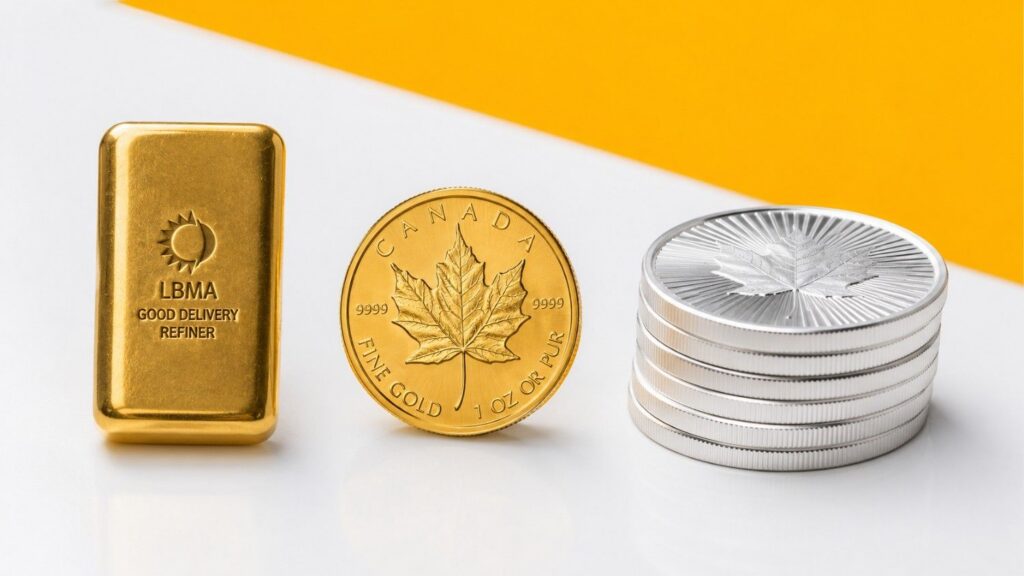
A correction creates buying opportunity — but only if you choose the right product. Here is which physical formats minimize premiums and deliver the most metal per dollar when prices dip.
Gold Is Down 26%. Silver Is Down 51%. What Does the Stacker Do Now?

Gold and silver have pulled back sharply from their January 2026 peaks. The structural case — six consecutive silver deficits, 863 tonnes of central bank gold buying, and a gold-silver ratio above its long-run average — has not changed. This guide covers the floor thesis, how to read the GSR as a strategic compass, and how dollar-cost averaging turns volatility into an advantage.
Gold Is About to Trade 24/7. A Prediction Market Just Filed to Make It Never Expire.
CME starts 24/7 gold futures trading this Sunday. Kalshi just filed for gold contracts that never expire. Here is what both changes mean for physical gold owners.
Gold Allocation Calculator: How Much Should Your Portfolio Actually Hold?

How much gold should your portfolio hold? The generic 5–10% guidance comes from 1980s research. Updated analysis puts the optimal range higher — and the right number for you depends on specific variables you can calculate.
