 Silver Rises Over 120% YTD




Gold Has a 0% Risk Weight and an 85% Funding Penalty. Banks Are Finally Asking Why.
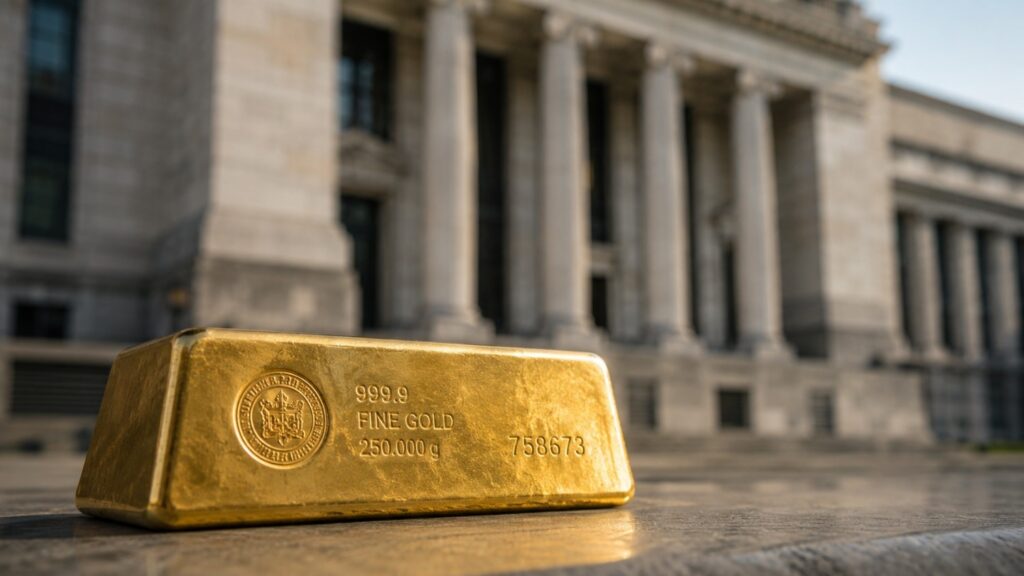
Gold has a 0% bank risk weight — the same as cash — but an 85% liquidity funding penalty under Basel III. Here’s the regulatory gap, why it exists, and what closing it means for gold demand.
Why Is Silver’s Mining Margin So Wide? Tavi Costa Explains
Silver’s recent price drop looks significant. The math behind it tells a different story. Macro strategist Tavi Costa breaks down why the $46 spread between silver’s spot price and its average mining cost is the widest in recorded history — and why that number matters far more than where silver traded last week.
Why Is Silver Down 5%? The Gold-Silver Ratio Explains.
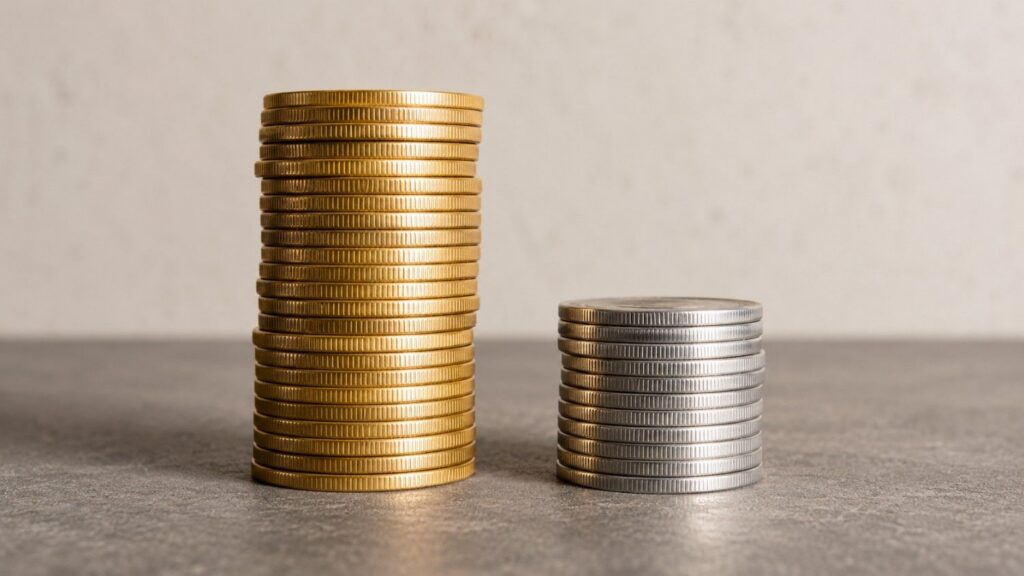
Gold is down 1.7% today. Silver is down 5.4%. The gold-silver ratio just hit 67 — and it’s not a valuation signal. It’s a real-time diagnostic of two forces colliding: the Iran peace dividend versus the Fed’s rate-hike threat. Here’s which one is winning, and why Thursday’s PCE report is the swing factor.
Is the Silver Rally Over? Tavi Costa Breaks Down the Selloff
Silver dropped more than 4% after Kevin Warsh’s first Fed press conference. Macro strategist Tavi Costa of Azoria Capital walks through the market signals, the dollar risk, and why the structural case for silver is unchanged.
Gold Is Down Today. The US Market Isn’t Open Yet.

US markets are closed for Juneteenth. The gold price dropping right now is being set by London and Asia — not American investors. Here’s what today’s move means, and what doesn’t
Half the Fed Wants a Hike. 45% of Central Banks Are Buying More Gold.

The Fed’s June 2026 dot plot split the committee down the middle on rate hikes, the dollar surged to its highest since May 2025, and silver posted its sharpest drop in weeks before recovering nearly 70% of the loss. The same week, the World Gold Council reported a record 45% of central banks plan to add gold. The headwinds are real. So is the floor.
GoldSilver’s New Chapter: What’s Coming Next

GoldSilver’s new chapter is here. A fully animated Creature from Jekyll Island series, new expert hosts, a learning hub, and more — here’s everything announced and why it matters.
Gold Holds at $4,347 While Stocks Hit All-Time Highs. Here’s Why.
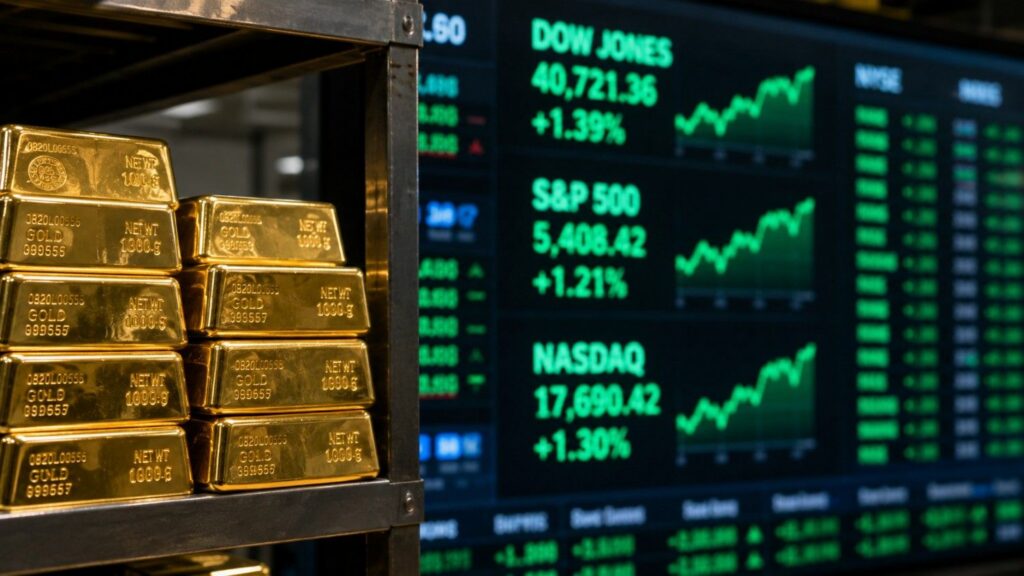
The Iran peace deal removed the war premium from gold. But the monetary premium — driven by $39 trillion in US debt, central bank buying, and fiscal deficits — is untouched. Here’s why gold held while stocks hit records, and what Warsh’s FOMC press conference means next.
Why Is Silver Up Today? The Iran Deal Changed the Fed Math
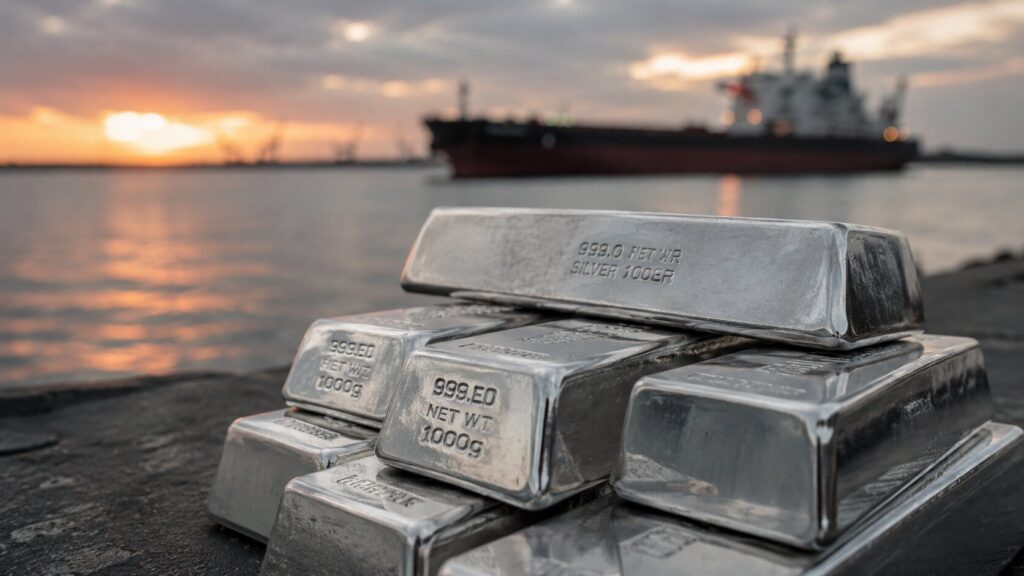
Silver is up while oil burns down. Most headlines are calling it a peace trade. They have the mechanism backwards. The real driver isn’t the war ending — it’s what cheaper oil does to Fed rate-hike expectations, real yields, and silver’s opportunity cost. Here’s the chain most coverage is missing.
Silver Fell 22% in 30 Days. Gold-Silver Ratio Hits 63.
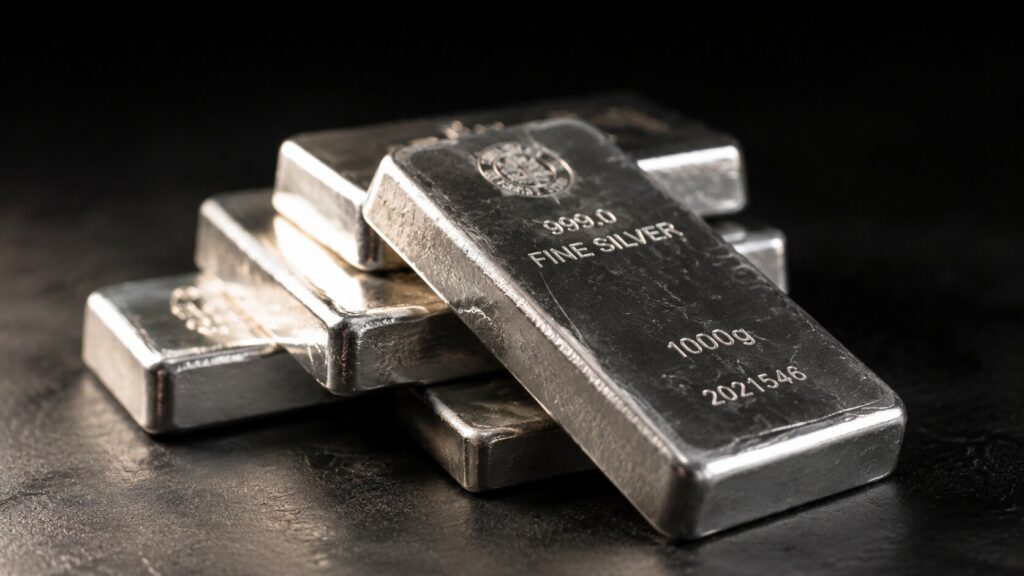
Over the past 30 days, silver has fallen more than twice as fast as gold. The gold-silver ratio now sits at 63 — up more than 8 points in a month. That move has a name, a mechanism, and a track record. Here is what drove it, and what comes next.


