 Silver Rises Over 120% YTD




Gold Surges 1.5%: ADP, ISM, and Beige Book Trap the Fed

Five data points landed Wednesday that should have pressured gold. Instead, gold surged 1.5%. Each event tightens the same Fed trap — and gold trades on the trap, not the direction the Fed falls.
Silver Has Two Engines. Stagflation Is the One Condition That Fires Both at Once.
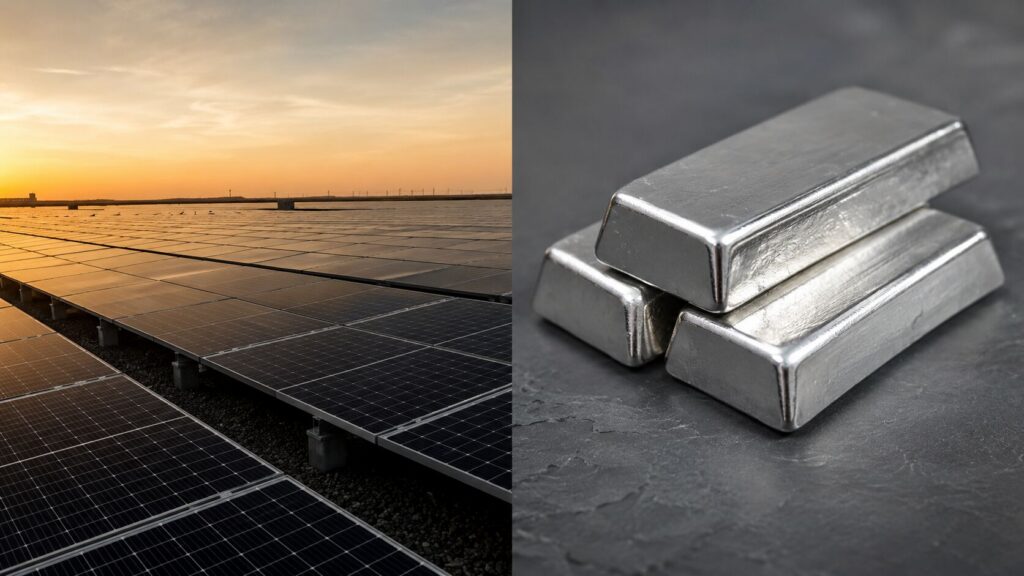
Most assets have a simple relationship with stagflation. Silver doesn’t. It answers to two entirely separate demand pools — industrial and monetary — that in most macro environments pull against each other. Stagflation is the rare condition where both pull in the same direction at once. Here’s why that matters for investors holding physical silver today.
Silver Lost 3.3% While Gold Lost 1.6%. That Gap Is Not Random.
Silver is falling more than twice as fast as gold today. The reason isn’t panic — it’s structure. Here’s the three-part mechanism behind silver’s amplified moves, and what six consecutive supply deficit years mean for long-term holders.
Silver Industrial Demand: Solar, EVs, and the Supply Gap

More than half of all silver mined each year gets consumed by industry — solar panels, electric vehicles, semiconductors. It doesn’t come back. Here’s the full breakdown.
Silver Dropped 12%. Gold Dropped 3%. That Gap Is the Story.

Silver’s 12% drop versus gold’s 3% isn’t a fluke — it’s the industrial demand premium unwinding. Here’s what the gold-to-silver ratio is telling you right now.
Gold Won’t Break. The Fed Just Told You Why.
The Fed just released its most hawkish minutes in over a decade. December rate hike odds hit 40%. The dollar surged. Gold barely moved. That non-reaction is not confusion — it’s the market pricing a structural ceiling on how far this Fed can actually tighten. Here’s the mechanism behind it.
Trump Called Off the Strike. Gold’s Real Risk Is Still $39 Trillion.
Trump’s decision to pause a planned Iran strike sent gold swinging $45 intraday and crude oil down more than 2% — but the two metals told completely different stories. Oil priced out the geopolitical risk. Gold barely moved. Five briefs explain why: Iran is the catalyst, not the cause. The monetary fundamentals driving gold — $39 trillion in national debt, fifteen years of money creation, central banks in their fifteenth straight year of net buying — don’t get resolved by a phone call.
Dollar-Cost Averaging Into Gold and Silver: The Investor’s Practical Guide

Most investors who want to own gold and silver never build the position they intend — not because the strategy is wrong, but because they keep waiting for the perfect moment to buy. Dollar-cost averaging solves that problem. This guide explains the mechanism, shows the math, and gives you a practical plan to build a precious metals position systematically — without needing to predict prices.
The Institutions Are Buying. Yields Are Rising. What Does That Tell You?

Goldman Sachs revealed central bank gold demand was being systematically undercounted. HSBC raised silver forecasts but flagged real limits. Treasury yields hit a one-year high. The institutions that understand sovereign debt risk best are still buying. Here’s what’s driving each story.
The Silver-to-Dow Ratio: How to Spot the Shift from Paper to Physical

Silver dropped ~10% after the Trump-Xi summit ended without a deal. The silver-to-Dow ratio — how many ounces it takes to buy the Dow — sits near 659 today. In 1980, it took just 18. That gap is the whole argument.


