 Silver Rises Over 120% YTD




Why Is Silver Up Today? The Iran Deal Changed the Fed Math
Silver is up while oil burns down. Most headlines are calling it a peace trade. They have the mechanism backwards. The real driver isn’t the war ending — it’s what cheaper oil does to Fed rate-hike expectations, real yields, and silver’s opportunity cost. Here’s the chain most coverage is missing.
Iran Peace Deal Sends Oil Down 5%, Gold Up 3%
The Iran peace deal was supposed to hurt gold. It didn’t. Here’s why oil falling 5% is pushing gold higher — and what that tells long-term holders about the monetary chain driving precious metals right now.
Gold & Silver Surge on Iran Peace Deal — Then Pull Back

Gold and silver surged Friday on Iran peace deal hopes, then pulled back. The real story is the oil drop — and the inflation chain it may be unwinding. Here’s the mechanism behind today’s move and what it means heading into the Fed’s first meeting under Kevin Warsh on June 16–17.
Silver Fell 22% in 30 Days. Gold-Silver Ratio Hits 63.
Over the past 30 days, silver has fallen more than twice as fast as gold. The gold-silver ratio now sits at 63 — up more than 8 points in a month. That move has a name, a mechanism, and a track record. Here is what drove it, and what comes next.
Every Bearish Catalyst Landed at Once. Gold and Silver Went Up Anyway.

Every bearish macro catalyst landed today at once — hot PPI, an ECB rate hike for the first time since September 2023, and a second night of US-Iran strikes. Silver opened at its lowest level since December 2025. By afternoon it was up 3.6%. Here’s what that market signal means for physical holders and what to watch before the FOMC on June 17.
Gold at Seven-Month Lows: Why Geopolitical Fear Is Not Enough

The Iran war should be pushing gold higher. Instead it is pushing the Federal Reserve toward rate hikes, suppressing the very safe haven the conflict should be lifting. Here is the mechanism behind five stories moving gold and silver today.
Gold Price News: Goldman, China, CPI, and the Fed Explained
Goldman Sachs just pushed every 2026 rate cut to 2027. China’s central bank bought gold for the 19th month in a row. CPI drops Wednesday. A fragile ceasefire is holding — barely. And silver just had its worst week relative to gold in months. Here is what each story means for precious metals investors.
Gold Near $4,330 as Rate-Hike Bets Hit 70% and China Acts
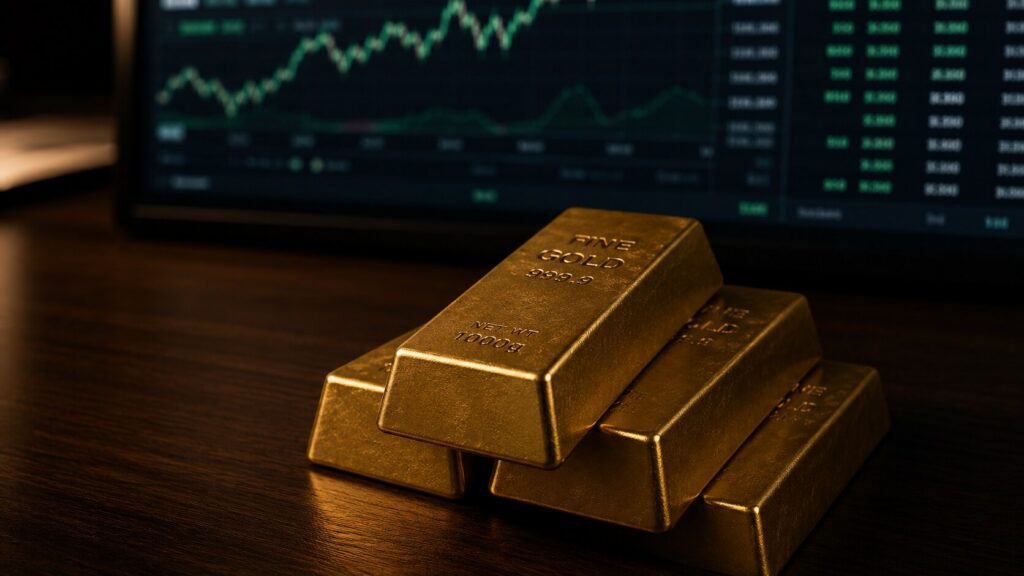
Five forces are moving gold and silver right now. Strong U.S. jobs data has pushed Fed rate-hike odds above 70%. China’s biggest banks raised gold trading margins to 120% — pushing leverage below 1x. The People’s Bank of China extended its buying streak to 19 straight months. Iran announced an end to its military operation against Israel, steadying metals after last week’s 5% pullback. And elevated oil is keeping inflation expectations alive. Here is what each one means for long-term precious metals holders.
Silver Falls 6% on Jobs Beat. The Six-Year Deficit Didn’t.
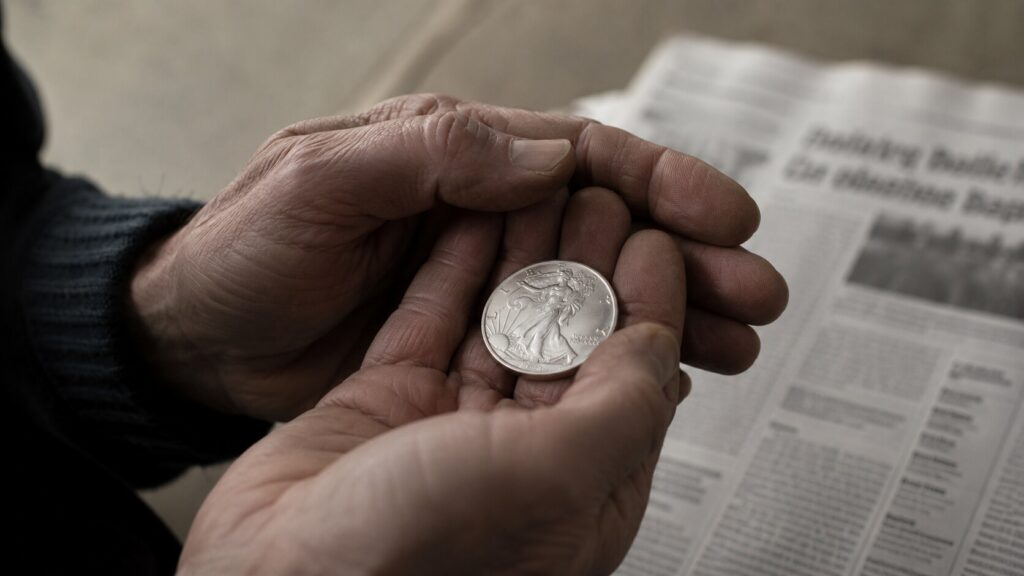
Silver fell nearly 6% after May’s blowout jobs report sent rate hike odds to 67% and the 10-year Treasury to 4.54%. Gold dropped too — but only half as much. Here’s why: silver runs on two engines. The jobs report hit the monetary one hard. The industrial one — solar, EVs, AI infrastructure — didn’t flinch. And the World Silver Survey 2026 deficit of 46.3 million ounces? Unchanged. One Friday’s data moves prices. It doesn’t move ounces.
Gold Rate Hike Fears Are Weighing on Prices. Here’s the Full Picture.

Gold slipped to $4,448 this week as rate-hike fears and Middle East tensions drove a 2% weekly loss. Central banks bought 244 tonnes in Q1 2026 — yet retail demand has cooled sharply. With May jobs data due today and gold holding just above its 200-day moving average, here is what five key developments mean for anyone holding precious metals right now.


