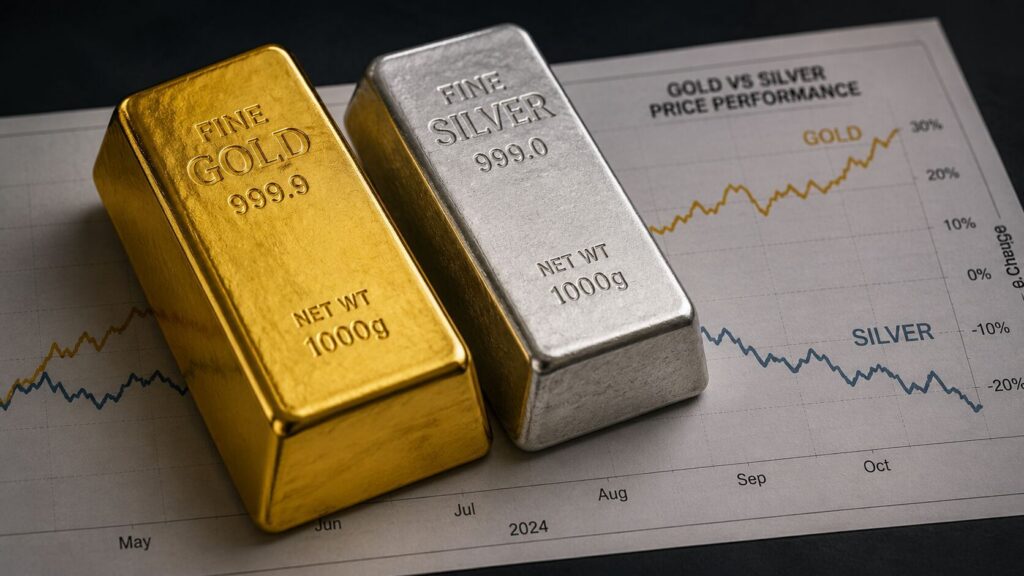
Why Is Silver Down 5%? The Gold-Silver Ratio Explains.
Gold is down 1.7% today. Silver is down 5.4%. The gold-silver ratio just hit 67 — and it’s not a valuation signal. It’s a real-time diagnostic of two forces colliding: the Iran peace dividend versus the Fed’s rate-hike threat. Here’s which one is winning, and why Thursday’s PCE report is the swing factor.
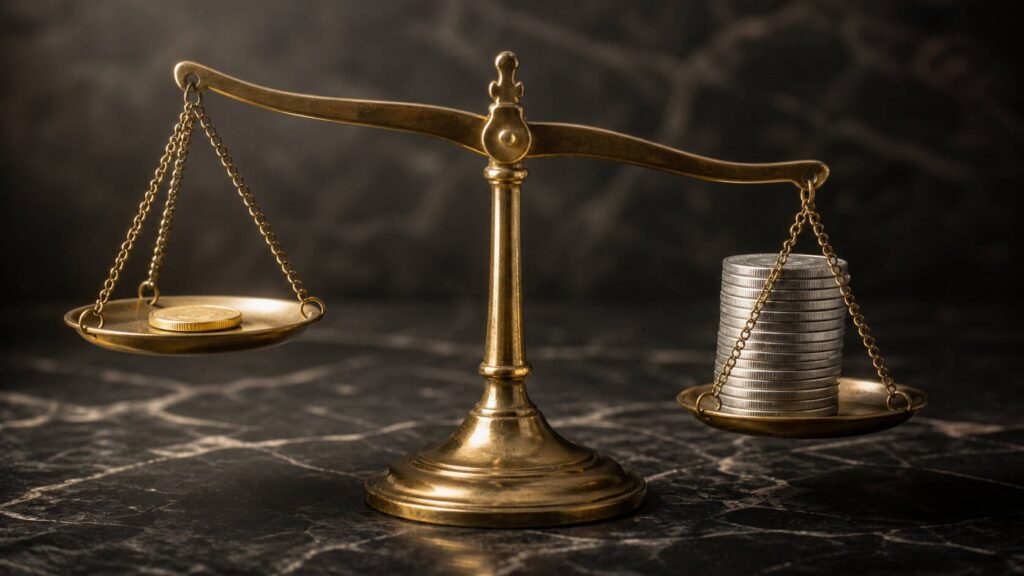
Gold Silver Ratio at 64: What It Signals for Silver in 2026
The gold/silver ratio fell from 85:1 to 64:1 in five weeks. History shows that at this level, compression is typically just beginning — not ending. Here’s what three major bull cycles say about where silver stands today.
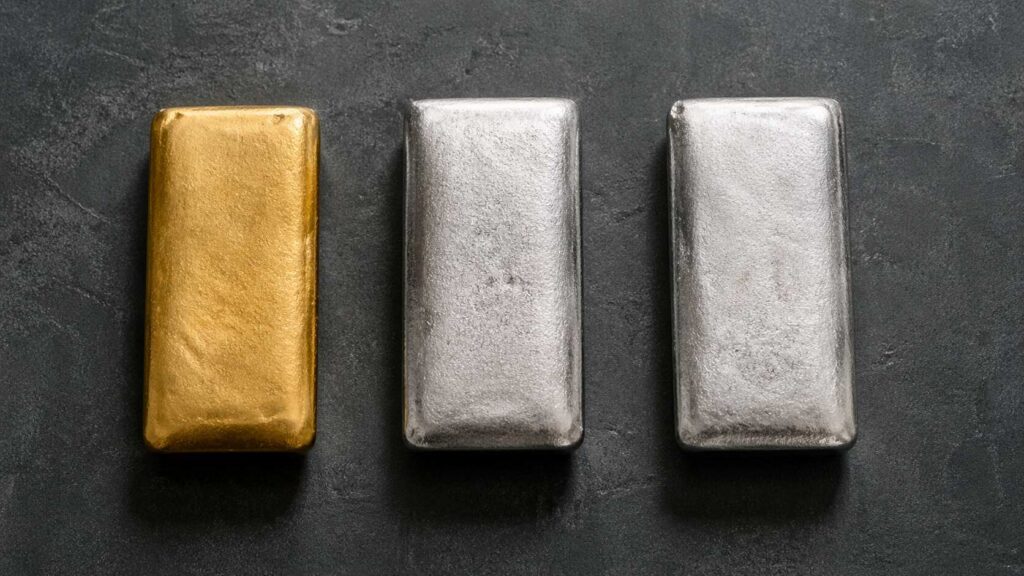
Silver Price Outlook June 2026: The Correction Was the Setup
Silver has fallen 42% from its January 2026 all-time high of $121.62. Most investors are reading that as a failed rally. We think it’s the opposite. Here’s what the data, the supply deficit, and the gold-silver ratio are actually saying about where silver goes from here.
Silver Lost 3.3% While Gold Lost 1.6%. That Gap Is Not Random.
Silver is falling more than twice as fast as gold today. The reason isn’t panic — it’s structure. Here’s the three-part mechanism behind silver’s amplified moves, and what six consecutive supply deficit years mean for long-term holders.
Silver Up 3%. Gold Up 1.3%. The Ratio Tells You Everything.

Silver climbed nearly three times as much as gold on Monday. The gold/silver ratio compressed to 58.7:1 — below the modern average — because silver is catching two bids at once. Here’s the mechanism.
Why Silver Falls Harder Than Gold — And What It Means
Silver fell 10× harder than gold on May 14, 2026 — not because of weakness, but because it runs on two demand engines: industrial and monetary. Three consecutive inflation beats repriced the industrial side. The monetary case got stronger.
The Gold-Silver Ratio Is Expanding — and Being Misread
The gold-silver ratio has expanded to 62.05:1 — silver is down ~7% since April 22 versus gold’s ~4%. Most investors are reading that as a bearish signal. Here’s why the ratio expansion is a short-term positioning story, and why the structural case for silver — six consecutive supply deficits, record China demand, Basel III tailwinds — has not changed.
The Gold-Silver Ratio Signal: What Silver’s Lead Means
Silver is up 2% while gold gains 1%. The gold-silver ratio is tightening. Most investors miss what that gap is actually signalling — here’s the full picture.
Silver Price Forecast 2026-2027: The bull case and bear case laid out
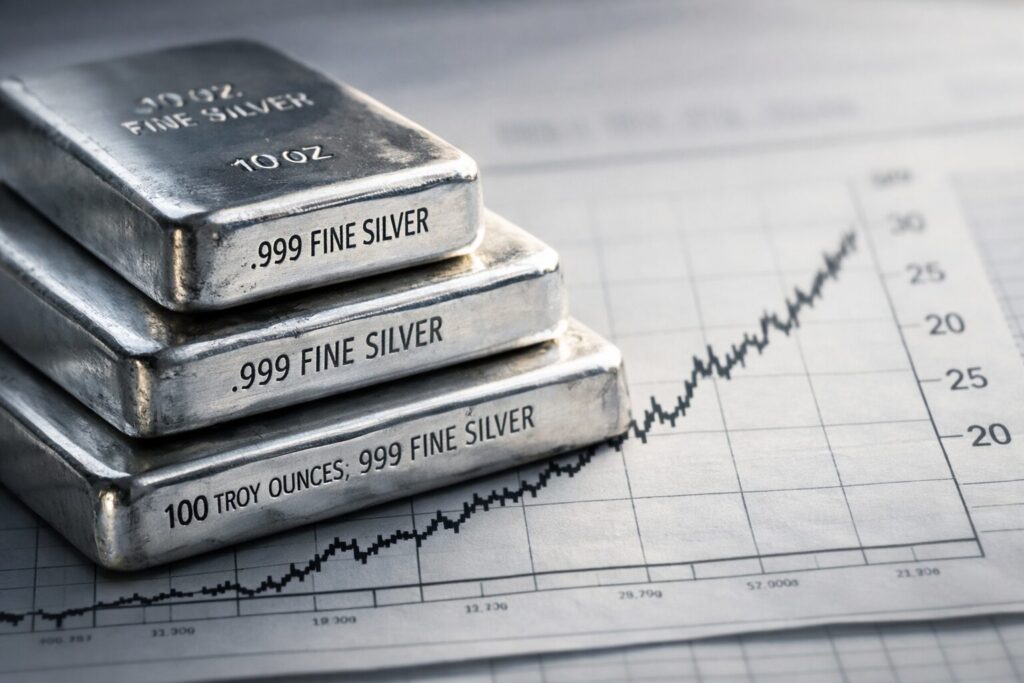
Silver surged 147% in 2025 and hit an all-time high of $121/oz in January 2026. But what comes next? This analysis breaks down the bull and bear case for silver prices in 2026–2027 — covering supply deficits, industrial demand, Fed policy, and institutional forecasts from J.P. Morgan, Commerzbank, and more — so you can make a more informed decision about your precious metals strategy.
What the Silver-to-CPI Ratio Reveals That Spot Price Hides
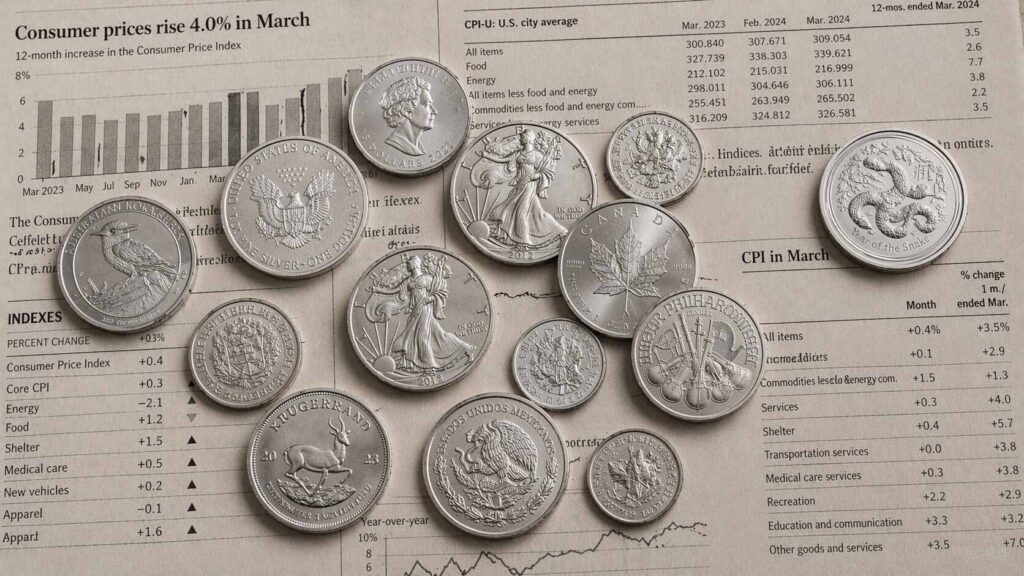
Silver hit a nominal all-time high of $121.64 in January 2026 — yet the silver-to-CPI ratio tells a different story. Adjusted for inflation, silver remains well below its 1980 peak and barely above its 2011 cycle high. Here’s what the ratio reveals that spot price alone never can.
