Published: 05-04-2026, 05:28 pm | Updated: 05-04-2026, 05:41 pm
Gold and silver market update — May 4, 2026
Key Takeaways
- The gold-silver ratio has expanded to 62.05:1 — silver fell ~7% since April 22 versus gold’s ~4%, meaning silver is underperforming, not leading.
- The expansion is a short-term cyclical response to ceasefire pricing unwinding silver’s industrial risk premium — the structural case (six-year supply deficit, record China demand, Basel III tailwinds) is unchanged.
- For sound money investors, a frozen Fed keeping real yields suppressed is silver’s most significant hidden tailwind — and at 62:1, silver carries more upside relative to gold if the monetary case reasserts.
Two weeks ago, silver was doing exactly what the sound money community had been expecting. The gold-silver ratio was compressing — approaching 60:1 — and silver was outperforming gold as both metals retreated from Iran-war highs. The thesis was playing out on schedule.
Since then, silver has fallen nearly twice as hard as gold. The gold-silver ratio has expanded back to 62.05:1 as of May 5, 2026. And if you read that as a change in silver’s structural story, you are reading the wrong message.
What Is the Gold-Silver Ratio and What Does It Mean Today?
The gold-silver ratio measures how many ounces of silver it takes to buy one ounce of gold. At 62.05, you need 62 ounces of silver to equal the value of one ounce of gold. A higher ratio means silver is weaker relative to gold. A lower ratio means silver is stronger.
Over the very long run — centuries of monetary history — the ratio was legally fixed at roughly 15:1 under bimetallic monetary standards (the U.S. Coinage Act of 1792 set it there explicitly). This was close to, though not directly derived from, the geological abundance of silver relative to gold in the earth’s crust, which the U.S. Geological Survey estimates at approximately 17.5 times more silver than gold. When governments stopped fixing the ratio and silver lost its monetary role in the late 19th century, that anchor disappeared.
Since 2000, the gold-silver ratio has ranged widely. It has spent most of its time between 50:1 and 90:1. Crises have produced violent spikes: the ratio hit 88:1 in late 2024 before silver’s historic rally, and briefly touched 125:1 in March 2020 during the COVID liquidity panic — the moment when everything got sold and gold held its ground while silver fell sharply.
While the ratio has drifted far from its historical 15:1 anchor, these modern extremes continue to serve as critical signals for identifying when silver is historically undervalued relative to gold.
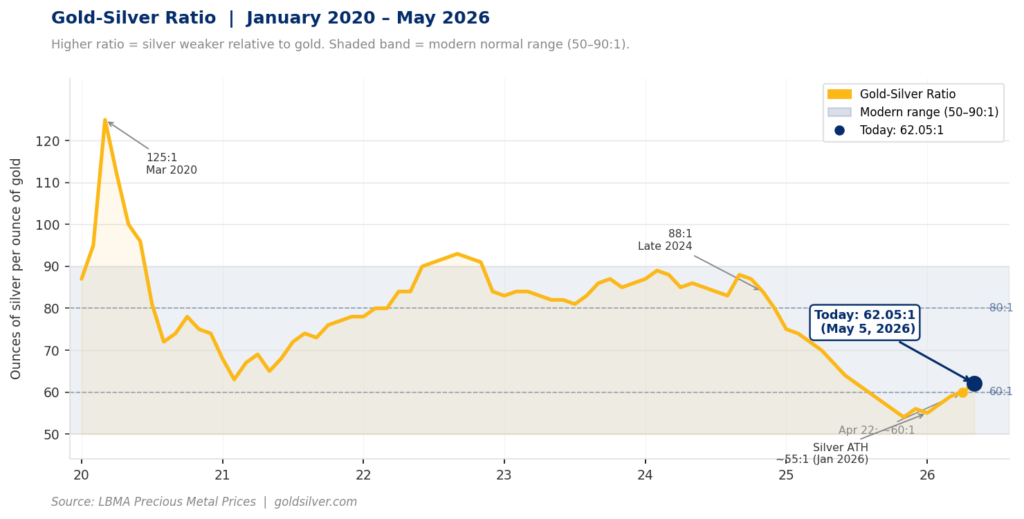
Today’s 62:1 sits in the lower-middle of that modern range. Not extreme. Not cheap in any historical sense. But the direction of the move over the past two weeks matters more than the level itself.

The Edge Every Investor Needs Smarter precious metals investing starts here. The Nuggets Newsletter brings you essential market insights, Fed updates, global trends, educational videos, and much more.
Why Is Silver Underperforming Gold Right Now?
Silver is a two-headed metal. One head is monetary — it has served as sound money for millennia, stores purchasing power, and moves with gold in response to real yield and dollar dynamics. The other head is industrial — roughly 60% of silver demand is industrial, driven today by solar panels, electric vehicles, 5G infrastructure, and semiconductors. That industrial demand is why silver typically outperforms gold when the economy is running hot, and why it underperforms when growth fears creep in.
Since April 22, the market has been pricing in a possible wind-down of the Iran conflict — not a resolution, but reduced acute escalation. When geopolitical tension falls, the safe-haven premium in both metals fades. Silver’s industrial head adds a second reason to sell: if energy supply disruptions ease, a global economy tightening on inflation fears might get a brief reprieve. The market sold silver harder because of it.
The data confirms the pattern. Silver peaked at $121.62/oz on January 29, 2026 — its all-time high, driven by a perfect storm of monetary and industrial demand. It has since pulled back roughly 39% to current levels. Gold, over the same period, has held significantly better. The ratio has expanded from near multi-year lows toward the middle of its modern range.
Has the Structural Case for Silver Changed?
No. The ratio expansion is a cyclical response to short-term positioning. The structural case for silver is, if anything, getting stronger.
The silver market is headed for its sixth consecutive annual supply deficit in 2026, according to the Silver Institute’s World Silver Survey 2026, published April 15. Since 2021, the world has drawn down roughly 762 million ounces from above-ground stockpiles to meet demand that production simply cannot match.
China’s silver imports hit an all-time record in March 2026, according to Chinese customs data. Two simultaneous forces drove the surge: retail investors buying physical silver bars as a cheaper alternative to gold, and solar manufacturers front-loading production ahead of China’s April 1 export tax rebate removal. It was the highest monthly import volume on record.
Basel III regulatory changes are gradually pulling bank capital away from paper silver markets, reducing the leverage that has historically suppressed spot prices. Banks have been quietly reducing their paper precious metals exposure in anticipation of the rules taking effect.
None of those structural realities changed between April 22 and today.
What Does the Gold-Silver Ratio at 62:1 Mean for Investors?
The 62:1 ratio at current prices (~$4,578 gold / ~$73.78 silver) carries three implications worth keeping in mind.
First, silver remains deeply below its all-time high relative to gold. When the gold-silver ratio last approached 50:1 — briefly, in early 2026 before the Iran conflict widened — silver was trading closer to $90–95. A return to that ratio range, with gold held above $4,500, implies silver in the $72–90 range depending on which direction gold moves. At 62:1, silver is not dangerously overvalued. But it is also not at an extreme low.
Second, the divergence between supply fundamentals and price action is widening, not narrowing. When the gap between structural reality and market pricing widens, history suggests the eventual re-convergence tends to be sharp. That is an observation about how commodity markets behave when positioning and fundamentals drift apart — not a price prediction.
Third, the Fed freeze is silver’s hidden tailwind. The Fed cannot raise rates into a weakening labor market, and it cannot cut with ISM Prices Paid at 84.6 — its highest level since April 2022. A Fed that is frozen keeps real yields suppressed. Suppressed real yields reduce the opportunity cost of holding non-yielding assets like gold and silver. At a 62:1 ratio, silver has more room to recover relative to gold if the monetary tailwind reasserts.
The Second Corner: What the Ratio Is Really Telling You
The surface read on today’s ratio is straightforward: silver underperformed, the ratio expanded, bearish signal. That is the first corner — what happened.
The second corner is this: silver underperforming gold in a short-term positioning shake-out does not mean silver’s structural case is weakening. It means the two parts of silver’s demand story are temporarily pulling in opposite directions.
- The monetary case — six-year deficit, Basel III capital rules, sound money thesis — is intact.
- The industrial case took a short-term hit from ceasefire pricing and manufacturing uncertainty.
For investors holding physical silver as part of a sound money allocation, the ratio at 62:1 is not a warning sign. It is a snapshot of where the market currently prices a two-headed metal when one of its heads is temporarily out of favor.
The six-year supply deficit does not care about ceasefire timelines. The solar demand curve does not care about the Iran conflict. The record China import volumes do not reverse on a diplomatic handshake. And the Federal Reserve’s inability to normalize policy — which is ultimately what drives the long-term case for both metals — certainly does not care about a two-week ratio drift.
The gold-silver ratio in 2026 is telling you something. Make sure you are listening to the right part of the message.
Stay On Top of Gold & Silver Prices
Get important market alerts sent straight to your inbox.
SOURCES
1. GoldSilver.com — Live Gold & Silver Price Charts
2. GovInfo.gov — U.S. Coinage Act of 1792
3. U.S. Geological Survey — Silver Statistics and Information
4. London Bullion Market Association — Precious Metal Prices & Historical Data
5. The Silver Institute — World Silver Survey 2026
6. General Administration of Customs, People’s Republic of China — Trade Statistics
7. Institute for Supply Management — ISM Report on Business
8. Bank for International Settlements — Basel III Framework
Disclaimer: This article is for informational purposes only and does not constitute financial or investment advice. Always consult a qualified financial adviser before making investment decisions.
You May Also Like:
- Gold, Silver, and Stagflation: 5 Signals That Matter Now
- Why Gold Fell on the Hormuz Tanker Strike
- WGC Q1 2026: What Asia Knows That Wall Street Doesn’t
- BEA Stripped Silver From GDP. Here’s What It Means
- PCE at 3.5%, GDP Miss: Why This Is Bullish for Gold
- How Warsh’s Inflation Measure Could Move the Gold Price
- Gold Is Down 19%. This $3.8B Bet Says It Doesn’t Matter
- Gold, Oil, and the Fed: Why the Old Rules Don’t Apply