Every Bearish Catalyst Landed at Once. Gold and Silver Went Up Anyway.

Every bearish macro catalyst landed today at once — hot PPI, an ECB rate hike for the first time since September 2023, and a second night of US-Iran strikes. Silver opened at its lowest level since December 2025. By afternoon it was up 3.6%. Here’s what that market signal means for physical holders and what to watch before the FOMC on June 17.
Gold Holds $4,481 With Rate Hike Risk Rising. Here’s the NFP Decision Map.
Gold is holding near $4,481 with rate hike risk rising — a divergence that, in any prior rate cycle, would have already sent gold lower. Tomorrow’s May jobs report is the last major data point before Warsh’s first FOMC meeting June 16–17. Here’s the three-scenario decision map: what a hot print, an in-line print, and a soft miss each mean for gold — and why the Fed’s policy trap makes the structural case for sound money regardless of Friday’s number.
Gold Surges 1.5%: ADP, ISM, and Beige Book Trap the Fed

Five data points landed Wednesday that should have pressured gold. Instead, gold surged 1.5%. Each event tightens the same Fed trap — and gold trades on the trap, not the direction the Fed falls.
Central Banks Just Crossed a Line Not Seen Since 1996

The ECB just confirmed gold has overtaken U.S. Treasuries as the world’s top reserve asset for the first time since 1996. India’s government denied selling $12 billion in gold the same morning Bloomberg said it did. And gold is trading $300 below what 30 Reuters analysts say it should be worth. Five signals. One story.
Factory Costs Hit 82.1. That Number Is Now Working for Your Gold.
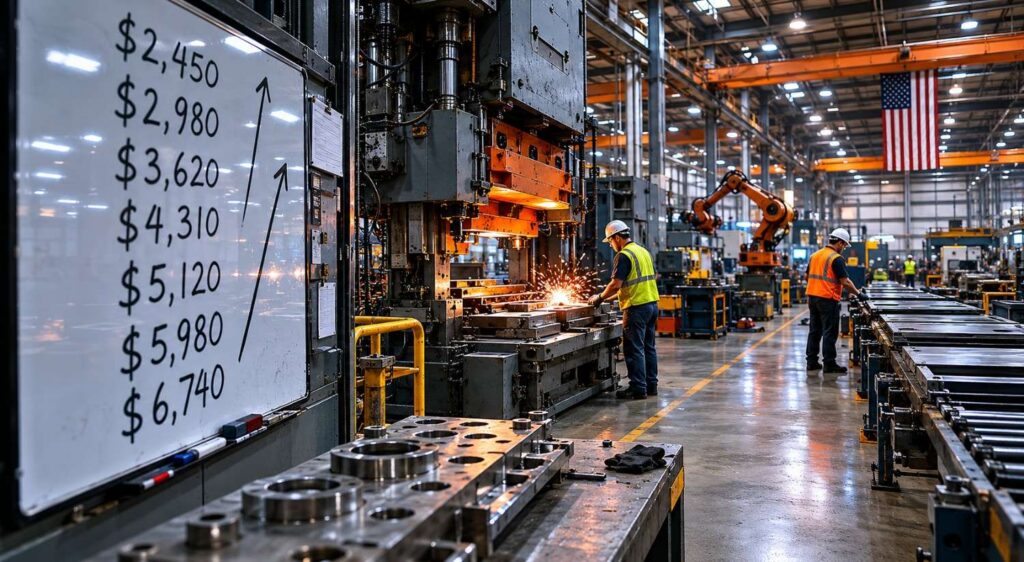
The ISM Manufacturing Prices-Paid Index hit 82.1 in May — the second-highest reading since 2022 and the 20th consecutive month of rising factory costs. Most headlines covered the manufacturing boom. Almost nobody explained what the prices-paid number means for the Fed, for inflation this summer, and for the structural case for holding gold.
Gold Price History: From $35 to $4,500 in 100 Years
Gold went from $35 in 1971 to around $4,500 today — a 12,000% gain since the gold standard ended. Meanwhile, the dollar lost 96.9% of its purchasing power over the same period. These are not two separate stories. This is the complete gold price history: decade by decade, the real cause behind every major move, and what a century of data tells investors right now.
The Debasement Trade Explained: Mechanism, History, and What It Means for Gold
Five years ago, “debasement trade” was Austrian economics jargon. Today Goldman Sachs, Citi, and J.P. Morgan use it in their research notes. Here’s what it means, why it works, and why gold and silver are the primary instruments.
Silver Has Two Engines. Stagflation Is the One Condition That Fires Both at Once.

Most assets have a simple relationship with stagflation. Silver doesn’t. It answers to two entirely separate demand pools — industrial and monetary — that in most macro environments pull against each other. Stagflation is the rare condition where both pull in the same direction at once. Here’s why that matters for investors holding physical silver today.
PCE Hit 3.8%. GDP: 1.6%. Gold Went Up. Here’s the Mechanism.
Yesterday’s BEA data confirmed what gold investors have been tracking all year: slow growth, hot inflation, and a new Fed chair with no clean policy options. Gold rose 1.5% on the day. Here’s why — and what comes next.
World Bank: Precious Metals to Surge 42% This Year
The World Bank’s April 2026 Commodity Markets Outlook projects a 42% surge for gold and silver — outpacing every other commodity class. Here’s what’s driving the forecast and what it means for long-term investors.
