Published: 04-22-2026, 11:34 am
Gold has no single fair value. At around $4,752/oz in April 2026, it is above its long-term inflation-adjusted average — but sits in the middle of its historical range relative to U.S. M2 money supply. The Dow/gold ratio of approximately 10 confirms a mature, not exhausted, bull market.
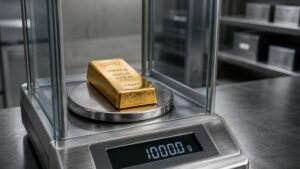
Gold is trading at roughly $4,752 per ounce as of April 22, 2026 [Trading Economics]. That is down approximately 15% from its all-time high set on January 28, 2026 [CBS News; LBMA Q1 2026 Market Report], yet still up 43% from a year ago.
A run like that demands a serious question: is this price justified, or has the rally overshot?
The answer depends entirely on which model you use to assess gold fair value. The forces driving gold — monetary expansion, central bank accumulation, persistent inflation — have not weakened. They have intensified. But different analytical frameworks reach different conclusions about what that means for price. Here is what each one actually shows.
What Is Gold Fair Value — and Why Is There No Single Answer?
Gold fair value is the theoretically justified price of gold per ounce based on underlying economic conditions. It is notoriously difficult to pin down for one fundamental reason: gold produces no cash flows.
Consider the contrast with other assets. A stock can be valued by discounting future earnings. A bond can be valued by its yield. Gold generates nothing. As a result, every fair value model is a comparison, not a calculation — anchoring gold’s price to something else entirely: the purchasing power of the dollar, the size of the money supply, or the relative cost of equities.
None of these frameworks is definitively correct. Instead, each captures a different dimension of what gold actually does in a portfolio and an economy. The three most widely used are the inflation-adjusted price model, the gold/M2 money supply ratio, and the Dow/gold ratio.

Your Gold Buying Guide Most investors overpay when they buy gold. Then overpay again when they sell. This guide shows you exactly what to own — and why.
Does the Inflation Model Say Gold Is Overpriced?
Inflation adjustment is the most intuitive place to start. Using the Consumer Price Index as a baseline, gold prices since 1980 expressed in 2025–2026 purchasing-power dollars produce a long-term average of around $1,400 per ounce [InflationData.com]. At today’s price near $4,750, gold is trading at more than three times that long-run real average.
The historical anchor matters here. Gold’s all-time nominal high of $850 in January 1980 — set during CPI inflation above 13% — equates to approximately $2,800–$3,200 in 2026 dollars, depending on the CPI methodology applied [BLS CPI Calculator; MacroTrends].
Consequently, gold’s recent $5,500+ peak was the first time the metal had ever genuinely surpassed the 1980 high in real purchasing-power terms — a milestone four decades in the making, and one that reframes gold’s 100-year record as an inflation hedge.
Gold is trading at more than three times its long-run real average — that is elevated by any historical standard. The caveat is that this model measures what gold cost in the past, not what the currency is actually worth today. If the dollar’s purchasing power has declined faster than CPI captures — and many economists argue it has, citing asset price inflation the index ignores — the fair value baseline itself needs to move up.
What Does the Gold/M2 Ratio Say About Where Gold Should Be?
The M2 model takes a more fundamental view. Rather than comparing gold to past prices, it compares gold’s price directly to the M2 money supply — the broadest commonly tracked measure of dollars in circulation. If the pool of dollars keeps expanding and the supply of gold does not, gold should rise in proportion.
The U.S. M2 money supply stands at approximately $22.7 trillion [Federal Reserve, February 2026], against official U.S. gold reserves of 8,133 metric tonnes [Trading Economics]. Historically, the gold/M2 ratio has swung from deeply undervalued — a ratio near 20 in 2000 — to extremely expensive, at a ratio near 2 at the 1980 peak [MacroTrends].
By early 2026, that ratio had compressed to approximately 5.
Even after more than doubling, gold has essentially kept pace with the extraordinary expansion of the money supply over the past two decades. In other words, it has moved from deeply undervalued to the middle of its historical range. That is not a warning sign — it is a normalisation.
What Does the Dow/Gold Ratio Say About the Bull Market?
The Dow/gold ratio divides the Dow Jones Industrial Average by the spot price of gold. It tells you how many ounces of gold it takes to buy one unit of the Dow — one of the oldest measures of gold’s value relative to financial assets.
Key historical benchmarks:
- 43 — dot-com bubble peak, 1999 (stocks at extreme premium to gold)
- 15 — 50-year average since gold began trading freely
- 6.7 — 2011 cycle low
- 1.3 — 1980 cycle low (gold at its most expensive relative to stocks)
- ~10 — April 2026 [GoldSilver.com]
A ratio of 10 sits well below the 50-year average of 15, confirming the bull market is real and well advanced. Nevertheless, cycle ends have historically arrived at ratios far lower than this — the 1980 low was 1.3, and the 2011 low was 6.7. On that basis, the ratio still has considerable room to compress before reaching the extremes that have marked previous cycle peaks.
Why the Models May All Be Underestimating Gold’s Floor
Every valuation model for gold is backward-looking by design. What none of them can quantify, however, is a structural demand shift that has no modern precedent.
According to the World Gold Council, central banks have been net purchasers of gold every year since 2010. Even so, the scale of buying since 2022 is in a different category entirely:
- Annual purchases exceeded 1,000 tonnes in 2022, 2023, and 2024 — a level not seen since the 1960s
- In 2025, purchases moderated to 863 tonnes — below that threshold, but still well above the pre-2022 average of 400–500 tonnes per year [World Gold Council, Gold Demand Trends Full Year 2025]
- J.P. Morgan projects approximately 755 tonnes of central bank purchases in 2026 — still nearly double pre-2022 norms [J.P. Morgan Global Research]
These are not speculative buyers reacting to price momentum. The scale and nature of central bank gold buying since 2022 deserves its own analysis — but the key point here is this: they are sovereign institutions making decade-long reserve allocation decisions — diversifying away from U.S. Treasuries and into gold as part of a structural realignment of the global reserve system.
Price-insensitive buyers operating on that kind of mandate simply do not appear in any inflation model calibrated to pre-2022 data. That is precisely why the models may be setting an artificially low floor.
So Is Gold Overvalued Right Now?
Gold is above its long-term inflation-adjusted average — but it is not at a historical extreme by any major measure.
The institutional forecasts point in the same direction. J.P. Morgan, which initially forecast gold averaging $5,055/oz in Q4 2026, raised its year-end 2026 target to $6,300/oz in February 2026, citing an “ongoing, unexhausted trend of reserve diversification” [J.P. Morgan Global Research].
Goldman Sachs made a comparable move — upgrading its year-end 2026 target from $4,900 to $5,400/oz in January 2026, then holding that target through gold’s sharp March 2026 correction rather than revising it down [Goldman Sachs].
Where gold looks most stretched is against other real assets — property and oil. Against financial assets and monetary aggregates, however, the valuation case holds — provided inflation stays above the Fed’s 2% target and central bank demand persists. If either condition reverses sharply, the models would need revisiting.
Ultimately, the more durable question is not whether gold is at fair value this week. It is whether the structural forces behind gold’s repricing over the past four years remain intact. By every current indicator, they do.
Stay On Top of Gold & Silver Prices
Get important market alerts sent straight to your inbox.
People Also Ask
What is the fair value of gold right now?
Gold has no single fair value. At approximately $4,750/oz in April 2026, the inflation-adjusted model shows it above its long-run average, the M2 model places it in the middle of its historical range, and the Dow/gold ratio of approximately 10 confirms a mature but not exhausted bull market. Elevated — but not historically extreme by any one measure.
How do analysts calculate gold’s fair value?
Analysts use three primary approaches: adjusting historical prices for CPI inflation to establish a real-terms baseline; comparing the gold price to M2 money supply to assess currency debasement; and tracking the Dow/gold ratio to measure gold’s value relative to equities. No single model is definitive — they are used together to build a picture.
Is gold overpriced at $4,750 per ounce?
By the inflation-adjusted model, yes — gold is trading at more than three times its long-run real average. By the M2 model, no — it sits in the middle of its historical range relative to the money supply. Institutional year-end 2026 forecasts from J.P. Morgan ($6,300/oz) and Goldman Sachs ($5,400/oz) suggest analysts see further upside from current levels.
What was the inflation-adjusted all-time high for gold?
Gold’s 1980 nominal peak of $850/oz equates to approximately $2,800–$3,200 in 2026 dollars, depending on the CPI methodology used [BLS CPI Calculator; MacroTrends]. When gold surpassed that range in 2025, it broke above the inflation-adjusted record for the first time in over four decades. The current price near $4,750 represents genuine new price discovery in real terms.
How does the money supply affect gold’s fair value?
When central banks expand the money supply, the purchasing power of each currency unit falls. Gold, which cannot be printed, tends to rise as a result. Analysts therefore track the gold/M2 ratio to measure how far gold has run relative to money printing. By early 2026, that ratio had moved from deeply undervalued territory to approximately the middle of its historical range.
Gold’s Floor Has Moved. The Models Are Still Catching Up
Gold fair value is a moving target, not a fixed number. The inflation model, the M2 model, and the Dow/gold ratio each tell a slightly different story — but they agree on the broad picture. At around $4,750/oz, gold is above its long-run averages. It is not, however, at the kind of extreme that has historically marked a cycle top.
The structural case remains intact: persistent inflation, a money supply that has grown exponentially since 1971, and central bank demand running well above its pre-2022 pace. Together, those forces continue to underpin a higher equilibrium price than any pre-2022 model would have suggested. If you want to understand gold’s role as a long-term store of value — and build a position around it — GoldSilver.com has the tools and research to get you there.
SOURCES
1. Trading Economics — Gold Price
2. CBS News — What Is the Highest Gold Price in History?
3. LBMA — Precious Metals Market Report: Q1 2026
4. InflationData.com — Inflation Adjusted Annual Average Gold Prices
5. U.S. Bureau of Labor Statistics — CPI Inflation Calculator
6. MacroTrends — Historical Gold Prices: 100 Year Chart
7. MacroTrends — Gold to Monetary Base Ratio
8. Federal Reserve Bank of St. Louis (FRED) — M2 Money Supply
9. World Gold Council — Gold Demand Trends Full Year 2025: Central Banks
10. J.P. Morgan Global Research — Gold Price Predictions 2026 and Beyond
11. Goldman Sachs — Gold Price Forecast and Outlook 2026
Disclaimer: This article is for informational and educational purposes only. It does not constitute investment advice. Please consult a qualified financial adviser before making any investment decisions.
You May also like:
- Silver Price Predictions for the Next 5 Years: Data-Backed Scenarios
- Tariff Refunds, Dollar Weakness, the AI Bust: Gold’s Case
- How to Buy Gold for Beginners: Step-by-Step Guide (2026)
- Silver Price Forecast 2026-2027: The bull case and bear case laid out
- How to Buy Silver Bars: The Investor’s Guide
- Why Silver Falls While Gold Rises: What It Means for You
- Why Are BRICS Countries Buying So Much Gold?
- Gold Price Forecast 2026–2027: Key Predictions from Top Analysts