Published: 04-21-2026, 03:22 pm | Updated: 06-12-2026, 09:28 am
Silver currently trades around $66.75 per ounce after pulling back roughly 45% from its January 2026 all-time high of $121.64. For the next five years, data points to a range of $90–$200+ depending on how industrial demand, supply deficits, and monetary conditions evolve. The structural case — five consecutive years of supply shortfalls (2021–2025), with a sixth projected for 2026, surging solar and EV demand, and a weakening dollar — has not changed. History suggests corrections within established bull markets are accumulation windows, not exits.
Price data and supply deficit figures last verified June 2026.
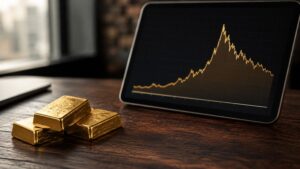
Silver hit a nominal all-time high of $121.64 on January 29, 2026 — the highest nominal price in the metal’s recorded history. Since then, it has pulled back to around $66.75 per ounce.
That pullback raises an obvious question: where does it go from here?
Any serious silver price prediction for the next 5 years has to be built on three things: the structural supply deficit, the industrial demand pipeline, and where monetary conditions are headed. This article maps those three forces into concrete bear, base, and bull scenarios. It also draws on institutional research and tells you exactly what variables to watch.
What’s Actually Driving Silver’s Price Over the Next Five Years?
No other major metal has two demand engines pulling simultaneously. Silver’s price is shaped by both industrial consumption and monetary demand — and right now, both are active.
On the industrial side, silver’s electrical conductivity is unmatched. As a result, it is non-substitutable at scale in solar photovoltaic cells, EV battery management systems, 5G infrastructure, and AI data center hardware. Industrial demand hit 680.5 million ounces in 2024, a fourth consecutive annual record.
The 2025 figure moderated slightly to 665 million ounces, as solar manufacturers aggressively thrifted silver per cell. However, the Silver Institute calls this a speed bump, not a structural shift [Silver Institute, World Silver Survey 2025].
On the monetary side, silver moves with gold when real interest rates fall, the dollar weakens, and investors seek stores of value outside the financial system. Right now, both forces are operating simultaneously. That is what makes this cycle structurally different from 2011, which was a monetary-only rally without today’s industrial tailwinds.

Your Gold Buying Guide Most investors overpay when they buy gold. Then overpay again when they sell. This guide shows you exactly what to own — and why.
Why the Supply Deficit Is the Most Important Number in These Silver Price Predictions
The single most important data point isn’t a price target. It is the cumulative supply deficit.
Silver ran a structural deficit for five consecutive years from 2021 through 2025, with a sixth projected for 2026. The 2025 shortfall alone reached an estimated 95 million ounces. Notably, UBS revised its 2026 silver deficit estimate sharply lower in May 2026 — from approximately 300 million ounces to 60–70 million ounces — citing weaker photovoltaic demand as solar manufacturers continue reducing silver content per cell [UBS Commodities Research, May 2026]. This narrows but does not eliminate the structural supply argument. In total, the cumulative five-year gap reached approximately 820 million ounces — roughly one full year of global mine output [Silver Institute / Metals Focus, World Silver Survey 2026].
Supply cannot close that gap quickly. Mine production has held flat at around 813 million ounces annually. Ore grades are declining and new project pipelines are thin. Furthermore, roughly 70% of silver is mined as a byproduct of gold, copper, and zinc. This means output does not respond to price signals the way primary metals do.
Meanwhile, demand keeps expanding. The Silver Institute and Oxford Economics project that solar, EV, and data center applications will drive industrial silver consumption materially higher through 2031. For example, the EU has committed to 700 gigawatts of solar capacity by 2030.
In addition, EVs require 25–50 grams of silver per vehicle — 67–79% more than a conventional combustion vehicle. As a result, global automotive silver demand is forecast to grow at 3.4% annually through 2031 [Silver Institute / Oxford Economics, Silver: The Next Generation Metal, December 2025].
Deficits of this scale deplete inventories. Depleted inventories take years to rebuild. That is the structural floor under this market.
What Are the Three Price Scenarios for the Next Five Years?
The deficit and demand data set the stage. What happens next depends on which of these three paths plays out.
Bear Case — $60–$90 per ounce
This outcome requires several things to go wrong simultaneously. Green energy deployment slows. Silver thrifting in solar cells accelerates faster than expected — copper-silver composites are already making incremental inroads. The EV transition stalls. Moreover, the Federal Reserve tightens more aggressively than markets expect, pushing real yields higher and reducing investment demand.
In that environment, silver consolidates below its 2026 highs and trades sideways. Even so, the cumulative supply deficit and constrained mine output make a return to pre-2024 price levels unlikely.
Base Case — $100–$140 per ounce
In the base case, industrial demand grows at moderate rates. The supply deficit persists at 50–100 million ounces per year. The Fed gradually eases and the dollar continues weakening.
Goldman Sachs projects silver averaging in the $85–$100 range through this phase of the cycle. Similarly, JP Morgan’s 2026 forecast puts the annual average around $81 [JP Morgan Global Research, How Will Silver Prices Fare in 2026?]. On ratio math alone — the gold-silver ratio currently sits near 63:1 — within its long-run average range — with gold moving toward major bank targets of $5,400–$6,000. At that ratio, silver at $85–$100 follows mechanically.
Bull Case — $150–$200+ per ounce
The bull case does not require a stretch. It simply requires existing trends to compound.
Solar and EV demand accelerates. Physical inventories tighten further. Investment inflows return at 2025 levels. Furthermore, the gold-silver ratio compresses toward historical bull market norms — it reached approximately 17:1 at the January 1980 peak. Under those conditions, prices well above $150 follow from the math.
At the extreme end, analyst Peter Krauth — author of The Great Silver Bull — has modeled $300 silver based on gold reaching $5,000. That is an outlier. However, 18 months ago, so was the base case.
What Are the Major Banks Actually Forecasting?
Price targets that would have seemed aggressive two years ago are now the institutional consensus.
Goldman Sachs projects silver averaging in the $85–$100 range and views it as a cornerstone metal of the green energy transition. Similarly, JP Morgan’s 2026 research forecast puts the annual average around $81.
In addition, the Silver Institute and Oxford Economics December 2025 report — which labels silver a “next generation metal” — projects that solar, EV, and AI data center demand will keep expanding through the full five-year horizon. The infrastructure underpinning that demand is vast.
Specifically, global IT power capacity has grown 5,252% since 2000, rising from 0.93 GW to nearly 50 GW in 2025 [Silver Institute / Oxford Economics, Silver: The Next Generation Metal, December 2025].
Is This a Good Time to Buy Silver?
After a 45% pullback, the structural case has not weakened — it has repriced.
The gold-silver ratio sits near 63:1 today — slightly above its long-run average of 60–65:1, with gold at ~$4,187 and silver at ~$66.75. This is far more balanced than the extreme readings above 100:1 seen in 2020 Macrotrends, Gold-to-Silver Ratio Historical Chart. Silver is not dramatically cheap relative to gold right now. However, it is not expensive either. The five-year argument rests on supply deficits and industrial demand fundamentals — not on ratio compression alone.
Silver corrected 30–35% multiple times during the 1970s bull run. Nevertheless, it then surged more than 700% in a single year — from roughly $6 at the start of 1979 to nearly $50 by January 1980. The forces behind silver’s approximately 144% gain in 2025 — structural deficits, green energy demand, dollar weakness, declining real rates — are still intact. Therefore, a correction resets the entry price. It does not reset the underlying thesis.
GoldSilver.com’s guide on How to Read the Gold-Silver Ratio — And What to Do About It walks through how to use the ratio as a practical allocation tool — not just a talking point.
Stay On Top of Gold & Silver Prices
Get important market alerts sent straight to your inbox.
People Also Ask
Will silver prices go down?
Silver could go lower in the near term — and it’s worth being honest about why. The Fed has pulled all 2026 rate cuts from its forecast, real yields remain elevated, and UBS cut its 2026 silver supply deficit estimate dramatically in May 2026 — from 300 million ounces to roughly 60–70 million ounces — citing weaker photovoltaic demand. Silver is currently trading near $66.75, already down 45% from its January 2026 all-time high of $121.64. A further decline toward the $60 bear-case floor is possible if the dollar strengthens and industrial demand disappoints. What hasn’t changed: five consecutive annual supply deficits totalling approximately 820 million ounces, structural industrial demand from solar, EVs, and AI data centers, and a gold-silver ratio near 63:1 that implies significant upside if gold moves toward major bank targets. The five-year structural case doesn’t rest on what silver does next quarter.
What is a realistic silver price prediction for 2030?
The base-case consensus points to $100–$140 per ounce by 2030. This assumes continued structural supply deficits, moderate growth in solar and EV industrial demand, and a gradually weakening dollar. The bull case — should green energy deployment accelerate and investment demand return at 2025 levels — extends toward $200 or higher.
Why has silver pulled back from its all-time high?
Silver hit a nominal all-time high of $121.64 in January 2026 and has since pulled back roughly 45% to around $66.75 per ounce as of June 2026. The decline reflects geopolitical-driven inflation concerns, profit-taking after an approximately 144% annual gain in 2025, and some softening in near-term industrial demand estimates. However, the structural supply deficit and long-term demand drivers have not changed.
Will silver ever reach $200 per ounce?
$200 silver sits within the bull-case scenario if the supply deficit compounds, gold continues its structural revaluation toward major bank targets of $5,000–$6,000+, and the gold-silver ratio compresses toward historical norms. It is not the consensus forecast — but it is not fringe speculation either, given what the supply and demand data shows.
How does the gold-silver ratio affect silver price predictions for the next five years?
The ratio (gold price divided by silver price) currently sits near 60:1, close to its post-1970 long-run average. If gold moves toward $5,000–$6,000+ and the ratio holds at 60:1, silver trades in the $83–$100 range. If, however, the ratio compresses toward the 40–50 range seen in late-stage bull markets, silver’s implied price rises substantially.
Is the silver supply deficit real, and does it affect price?
Yes — confirmed by the Silver Institute’s World Silver Survey. The 2025 shortfall reached approximately 95 million ounces, the fifth consecutive annual deficit. As a result, the cumulative five-year gap from 2021 through 2025 reached around 820 million ounces. Sustained deficits at that scale deplete above-ground inventories, reducing the market’s ability to absorb demand spikes — which creates upward price pressure over time.
Where Silver Goes From Here
Silver’s five-year price trajectory comes down to a widening gap between structural supply constraints and surging industrial demand — with a weakening dollar and declining real rates as the accelerant.
To summarise: the bear case is $60–$90, requiring multiple tailwinds to reverse simultaneously. The base case is $100–$140, supported by institutional forecasts and the math of persistent deficits. The bull case extends well above $150, if existing trends continue compounding.
Understanding the forces behind a move matters more than guessing the number. The supply deficit, the demand pipeline, the ratio — these are the variables worth tracking. If you want to go deeper on how physical silver fits into a long-term portfolio, GoldSilver.com is a good place to start.
SOURCES
Silver Institute — World Silver Survey 2025
Silver Institute / Metals Focus — World Silver Survey 2026
Silver Institute / Oxford Economics — Silver: The Next Generation Metal, December 2025
JP Morgan Global Research — How Will Silver Prices Fare in 2026?
Macrotrends — Gold-to-Silver Ratio: 100 Year Historical Chart
This article is for informational purposes only and does not constitute investment advice. Precious metals investing involves risk, including the possible loss of principal. Price data referenced as of June 2026. Consult a qualified financial advisor before making investment decisions.
You may also like:
- How to Buy Gold for Beginners: Step-by-Step Guide (2026)
- Silver Price Forecast 2026-2027: The bull case and bear case laid out
- How to Buy Silver Bars: The Investor’s Guide
- Why Silver Falls While Gold Rises: What It Means for You
- Why Are BRICS Countries Buying So Much Gold?
- Gold Price Forecast 2026–2027: Key Predictions from Top Analysts
- Is Now a Good Time to Buy Gold? Here’s the Macro Case
- Is Gold a Better Investment Than Bitcoin Right Now?