Published: 05-11-2026, 04:57 pm
Gold and silver market update — May 11, 2026
Key Takeaways
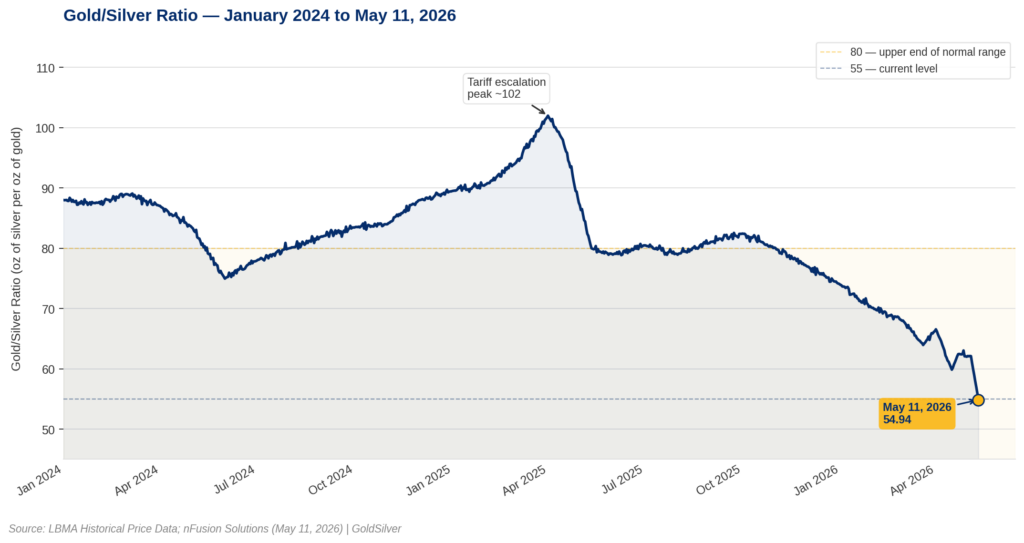
- The gold/silver ratio measures how many ounces of silver it takes to buy one ounce of gold — as of May 11, 2026, it stands at 54.94, down from 62.05 just one week earlier
- Silver surged 7.1% to $86.10/oz today while gold barely moved at $4,730 — the catalyst is a US-China 90-day tariff truce that directly reprices silver’s industrial demand outlook (prices per nFusion Solutions, ~3:49 PM ET)
- According to the Silver Institute, silver has run a supply deficit for six consecutive years, with roughly 762 million troy ounces drawn from above-ground stockpiles since 2021 — the structural case for silver was in place long before this week
The gold/silver ratio measures how many ounces of silver it takes to buy one ounce of gold. When it falls, silver is outperforming. Right now it’s falling fast — from 62.05 a week ago to 54.94 today — after silver surged 7.1% to $86.10 on a US-China tariff truce. That kind of compression in under a week is rare. It tends to happen when a catalyst hits a metal that was already primed to move. Silver was primed: according to the Silver Institute, it has run a supply deficit for six consecutive years.
What Is the Gold/Silver Ratio — and What Does 54.94 Actually Mean?
The gold silver ratio doesn’t tell you whether to buy. It tells you relative value. A ratio of 55 means one ounce of gold currently buys 55 ounces of silver, while at 88 — where it stood in early 2024 — silver was cheap relative to gold. The lower the ratio, the more ground silver has reclaimed.
In normal markets, the ratio has historically ranged from roughly 40 to 80. Extremes revert. It hit 125 in March 2020 — a pandemic-panic outlier — before compressing back to the mid-60s by August of that year. At 54.94 today, the ratio is near the low end of its historical range. That’s not a buy signal. It’s context: silver has already closed a lot of ground, which makes the next directional move meaningful.

The Edge Every Investor Needs Smarter precious metals investing starts here. The Nuggets Newsletter brings you essential market insights, Fed updates, global trends, educational videos, and much more.
Why Is Silver Outperforming Gold Right Now?
Two forces hit silver simultaneously this week. They reinforce each other.
The first force is trade: the US and China announced a 90-day tariff truce over the weekend. US tariffs on Chinese goods dropped from 145% to 30%; Chinese tariffs on US goods fell from 125% to 10%. For gold, that news is roughly neutral. Silver, however, gets a direct demand signal. According to the Silver Institute, approximately 60% of silver’s annual consumption is industrial — solar panels, electric vehicle batteries, and semiconductors. Most of that supply chain runs through China. When the tariffs came down, traders immediately repriced silver’s demand outlook. The 7% single-session move is that repricing happening in real time.
Underlying that trade catalyst is a second, structural force. According to the Silver Institute, silver has run a supply deficit for six consecutive years — the world consumes more than it mines. The 2026 deficit is projected at 46.3 million ounces, up 15% from 2025. Since 2021, roughly 762 million troy ounces have been drawn from above-ground stockpiles. The trade truce lit the match. Six years of deficits was the fuel.
Has a Ratio This Low Ever Predicted a Bigger Silver Move?
It has — though the setup matters as much as the level. The clearest recent parallel is 2020, when the pandemic pushed the ratio to 125 in March — an extreme by any historical measure. As the shock faded, silver rallied roughly 45% over the following months while the ratio compressed back to the mid-60s by August. The starting point this time is far less extreme. But the direction and velocity are similar.
The fair pushback: a 90-day truce is not a trade deal. If US-China negotiations break down before the deadline, silver’s industrial demand thesis softens and the ratio can re-expand quickly. That’s a real risk. But six years of supply deficits, documented by the Silver Institute, don’t evaporate on a failed negotiation. The structural bid existed before this week. All the truce did was remove a ceiling — it didn’t create the floor.
What Does the Ratio Tell Long-Term Precious Metals Holders?
Not what to do today — what to understand about where we are. Silver’s dual nature is the point. It’s part monetary metal, part industrial feedstock. When real yields fall, gold tends to lead. As industrial activity picks up, silver tends to overshoot. Right now both conditions are present, which is why silver is moving faster.
A ratio of 54.94 means silver has been closing the gap with gold since early 2024, when it sat at 88. Fiat currency systems erode purchasing power gradually, through inflation and monetary expansion. Gold and silver both resist that erosion — but they don’t always move in lockstep. The ratio is the scoreboard. Right now, silver is catching up. That’s not alarming. That’s the system working the way it’s supposed to.
Prices as of May 11, 2026, approximately 3:49 PM ET.
Stay On Top of Gold & Silver Prices
Get important market alerts sent straight to your inbox.
SOURCES
1. nFusion Solutions — Spot Price Data
2. Silver Institute — World Silver Survey 2026
3. White House — US-China Trade Statement, May 2025
4. London Bullion Market Association — Historical Precious Metals Price Data
Disclaimer: This article is for informational purposes only and does not constitute financial or investment advice. Always consult a qualified financial adviser before making investment decisions.
You May Also Like:
- What’s Moving Gold Prices This Week: CPI, Seoul & Beijing
- Silver Jumps 6% Before Trump-Xi Summit. Here’s Why
- April Jobs Beat 115K. Gold Held. The Dollar Didn’t. Here’s Why
- Jobs Beat, Ceasefire, Deficit: What It Means for Gold
- Gold Price Outlook: Oil Futures Disagree With Stock Markets
- Why Silver Hit $82 Today: Iran, Oil, and the Fed
- Gold Hits $4,746 as Oil Crashes. Here’s Why That’s Bullish
- Gold Price and Nonfarm Payrolls: Why the Fed Is Trapped