Published: 05-08-2026, 04:39 pm
Gold and silver market update — May 8, 2026
Key Takeaways
- April 2026 nonfarm payrolls printed 115,000 — more than double the 55,000 Dow Jones consensus — yet gold held above $4,700 and the dollar weakened. Average hourly earnings missed at +0.2% vs. +0.3% forecast (BLS, May 8, 2026), closing the policy door in both directions: too-soft wages to justify a hike, too-hot inflation expectations to justify a cut.
- University of Michigan May 2026 preliminary: year-ahead inflation expectations 4.5%, down only slightly from April’s finalized 4.7% — both above the Fed’s 3.50–3.75% policy rate, implying negative real returns on cash.
- CME FedWatch priced a June hold above 95%; central banks had bought gold for 18 consecutive months as of April 2026. A Fed that can neither cut nor hike is structurally supportive of gold.
On May 8, 2026, April nonfarm payrolls came in at 115,000 — more than double the 55,000 Dow Jones consensus. Gold barely moved. Instead, the dollar sold off. That inversion is the story.
Gold is at $4,723 as of approximately 3:21 PM ET (source: nFusion Solutions), up 0.80%.
Why gold held after a strong jobs report: On May 8, 2026, April nonfarm payrolls beat expectations by more than 2x. Gold held above $4,700. The US dollar weakened — the opposite of the normal jobs-beat relationship. Fed paralysis explains why. With the University of Michigan’s May 2026 preliminary survey showing year-ahead inflation expectations at 4.5% (down only slightly from April’s 4.7%), the Fed cannot cut without entrenching those expectations. It also cannot hike.
A labor market the BLS described as showing “little net change over the prior 12 months” cannot absorb aggressive tightening. Before today’s jobs data, CME FedWatch already put the June hold probability above 95%. For gold and silver investors, this dynamic has a name: a frozen central bank. That is historically one of the most reliable structural tailwinds precious metals have ever had.

The Edge Every Investor Needs Smarter precious metals investing starts here. The Nuggets Newsletter brings you essential market insights, Fed updates, global trends, educational videos, and much more.
What Did the April 2026 Jobs Report Actually Show?
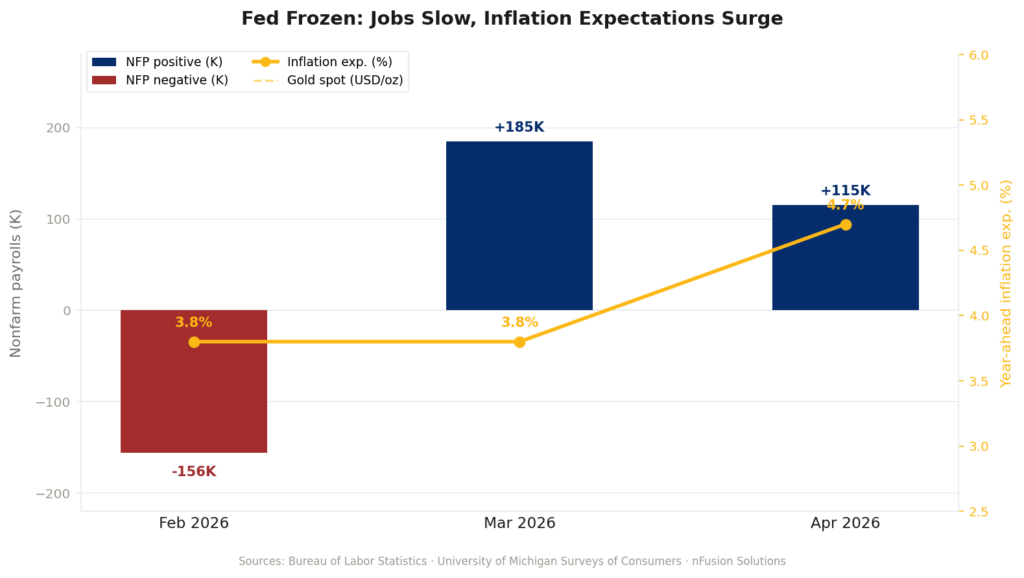
At 8:30 AM ET, the Bureau of Labor Statistics reported 115,000 nonfarm payroll jobs added in April. That figure was more than double the 55,000 Dow Jones consensus and well above the 62,000 median tracked by Reuters. March was also revised higher, to 185,000. Unemployment held at 4.3%. Gains concentrated in healthcare (37K), transportation and warehousing (30K), and retail trade (22K). Federal government shed another 9,000 positions. The BLS noted the gain came “after showing little net change over the prior 12 months.”
Crucially, average hourly earnings rose just 0.2% month-over-month, missing the 0.3% consensus. At 3.6% year-over-year (BLS), wages are cooling. Soft wages alongside a strong headline is the clearest signal of the day. The economy is adding jobs but not generating wage-driven inflation. Without that, the Fed has no justification to hike. That closes the policy door in both directions.
At 10:00 AM ET — ninety minutes after the jobs data — the University of Michigan’s May preliminary Consumer Sentiment survey landed. Year-ahead inflation expectations came in at 4.5%, a modest pullback from April’s finalized 4.7%. April’s reading had itself jumped sharply from 3.8% in March. Long-run expectations held at 3.5%, the highest since October 2025.
Why Did the Dollar Fall on a Strong Jobs Report?
The Fed is trapped — and today’s report tightened the trap. On the cut side, consumers still expect 4.5–4.7% inflation — well above the pre-pandemic norm of 2.3–3.0%. Every cut risks entrenching those expectations and repeating the Fed’s 2021–2022 mistake. On the hike side, a labor market with “little net change over the prior 12 months” (BLS) cannot absorb aggressive tightening. Soft wages reinforce that: there is no wage-price spiral to break. CME FedWatch puts the June hold probability above 95%.
EUR/USD and GBP/USD both advanced intraday. The dollar softened on a blowout jobs print. Gold held. That’s the market pricing a credibility problem, not a payroll number.
What Are Markets Pricing for the Fed’s June 17 Meeting?
Before today’s data, CME FedWatch data as of May 6 already showed a 95.9% probability of a June hold. The NFP beat pushed that probability even higher. Meanwhile, Reuters analysts surveyed before today’s print put the 2026 average gold price forecast at $4,916. That figure is up from $4,746 just three months ago. Gold is up 41.6% year-over-year (TradingEconomics). That gain reflects accumulated pressure — fiscal deficits, war-driven energy inflation, and a Fed that cannot claim victory on either mandate.
What Does Fed Paralysis Mean for Physical Gold and Silver Investors?
Even at 4.5%, consumers expect inflation nearly a full percentage point above the Fed’s policy rate of 3.50–3.75%. That gap represents a negative real return on cash savings. When central banks lose inflation credibility, demand for assets outside the monetary system historically follows. That is the structural tailwind beneath gold — not geopolitics, not a single data release.
Is This a Temporary Spike or a Structural Shift in Gold’s Floor?
The back-to-back Michigan readings — 4.7% in April, 4.5% in May — are not primarily about Iran or gasoline. They reflect accumulated distrust. Three years of inflation ran hotter than the Fed projected. The policy response came late. Then a war reopened energy disruptions just as consumers thought it was over. As of April 2026, central banks had purchased gold for 18 consecutive months — the longest uninterrupted streak on record, per World Gold Council demand data reported by Reuters. When institutions and consumers move expectations in the same direction, that is not a trade. That is a floor.
What to Watch Next
CPI for April drops Tuesday, May 12. PPI follows Wednesday, May 13. If both come in elevated, gold’s floor above $4,700 gets harder to break.
Stay On Top of Gold & Silver Prices
Get important market alerts sent straight to your inbox.
SOURCES
1. Bureau of Labor Statistics — The Employment Situation, April 2026
2. U.S. BLS — CPI Release Schedule 2026
3. U.S. BLS — PPI Release Schedule 2026
4. University of Michigan Surveys of Consumers — May 2026 Preliminary Results
5. CME Group — CME FedWatch Tool
6. Federal Reserve — FOMC Statement, April 28–29, 2026
7. Reuters — Gold Price Analyst Survey, 2026
8. World Gold Council — Gold Demand Trends, Q1 2026
9. nFusion Solutions — Metals Spot Price API, May 8, 2026
10. TradingEconomics — Gold Spot Price, May 8, 2026
Disclaimer: This article is for informational purposes only and does not constitute financial or investment advice. Always consult a qualified financial adviser before making investment decisions.
You May Also Like:
- Jobs Beat, Ceasefire, Deficit: What It Means for Gold
- Gold Price Outlook: Oil Futures Disagree With Stock Markets
- Why Silver Hit $82 Today: Iran, Oil, and the Fed
- Gold Hits $4,746 as Oil Crashes. Here’s Why That’s Bullish
- Gold Price and Nonfarm Payrolls: Why the Fed Is Trapped
- Gold Is Decoupling From Geopolitics. Here’s the Proof
- The Fed Is Frozen. The Debt Is Growing. Gold Is Watching.
- Gold Jumps on Iran Deal Hopes. The Real Driver Is the Fed