Silver Rises Over 120% YTD




Published: 07-15-2026, 04:34 pm | Updated: 07-15-2026, 04:52 pm
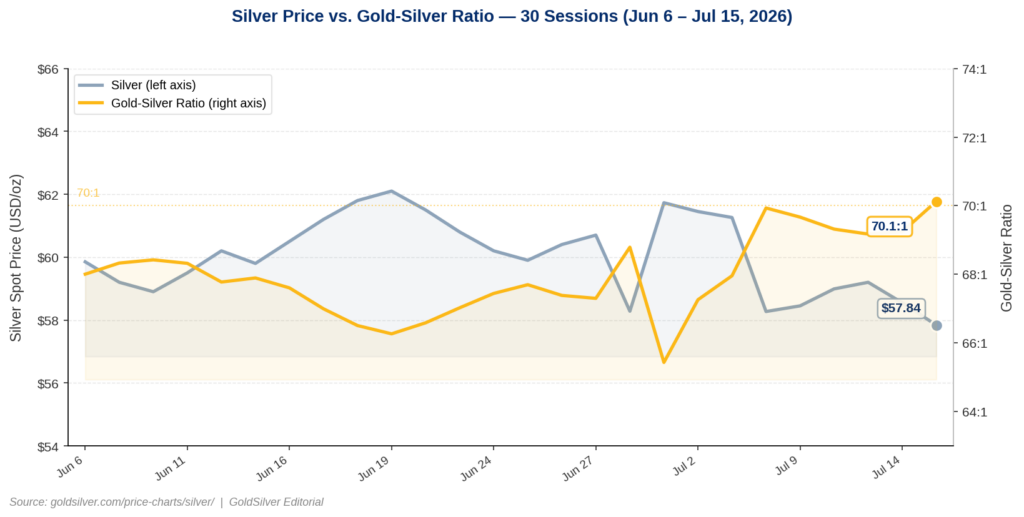
Gold and silver are supposed to move together. Today, they didn’t. Gold finished the session essentially flat, up less than a tenth of a percent. Silver dropped 1.4%, touching $57.84 an ounce. As a result, the gold-silver ratio reached 70:1. That means one ounce of gold now buys more than 70 ounces of silver — near the high end of its range over the past two years.
Why Does the Gold-Silver Ratio Matter for Investors?
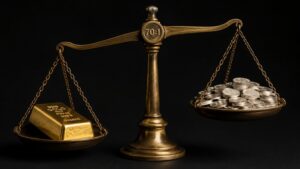
The gold-silver ratio measures how many ounces of silver it takes to buy one ounce of gold. With gold at $4,056 and silver at $57.84, that number is currently 70:1. Historically, the ratio has ranged from roughly 30:1 at its tightest to 127:1 at its widest. The extreme hit in March 2020, when COVID-19 panic briefly pushed silver to historic lows. At 70:1, the ratio is not extreme. However, it does signal that silver has meaningfully lagged gold, and that the two metals are currently being priced by different forces.

The Edge Every Investor Needs Smarter precious metals investing starts here. The Nuggets Newsletter brings you essential market insights, Fed updates, global trends, educational videos, and much more.
What Is Driving Silver’s Underperformance Today?
Silver runs on two demand engines simultaneously, and one is stuck right now. About 58% of all silver demand is industrial — solar panels, semiconductors, EV components, and medical devices — according to the Silver Institute’s World Silver Survey 2026. That industrial engine ties silver partly to global economic growth. When investors worry that higher interest rates will slow growth, silver’s industrial demand outlook weakens alongside it.
That is precisely what is happening in July 2026. The Fed’s rate path remains genuinely uncertain. The FOMC meets July 28–29. While July hold probability sits near 90%, the September meeting remains live — CME FedWatch still prices meaningful odds of a September hike. Consequently, industrial-demand expectations stay suppressed, and silver takes a hit that gold does not.
Gold, by contrast, runs on a single engine: monetary demand. Central banks buy it, institutions hold it, and long-term savers allocate to it as a purchasing-power hedge. None of those motivations depend on GDP growth. Additionally, gold got a modest lift today as June CPI and PPI both missed on the downside this week, reducing real-yield pressure on the monetary metal. Silver received the same monetary tailwind. However, it simultaneously lost ground on the industrial side — and the net result was a 1.4% decline.
What Do Analysts Say About Silver’s Setup?
At 70:1, institutional forecasters have not changed their targets. JPMorgan’s base case for silver remains $81 per ounce in 2026 — implying a ratio closer to 50:1 at current gold prices. The LBMA’s 2026 analyst consensus stands at $79.57 per ounce. Notably, analysts have revised the path, not the destination. For the full context behind silver’s two-month correction and those targets, see our Silver Price Outlook July 2026.
The structural supply case, moreover, remains intact. The Silver Institute confirmed the sixth consecutive annual supply deficit at 46.3 million ounces in its 2026 World Silver Survey. Since 2021, cumulative above-ground drawdowns have reached 762 million ounces — the equivalent of roughly nine months of global mine supply absorbed by industrial and investment demand. That physical reality does not reset because short-term rate-hike odds shifted on a soft inflation print.
The Real Story Behind the Ratio: Two Signals Running at Once
Today’s divergence is not simply a price move. It reflects two economic signals running in parallel, and both can be true simultaneously.
Gold is saying: inflation is softening, real yields are easing, and the structural bid from central banks remains intact. Silver is saying: growth uncertainty is high enough that industrial demand could soften if rates stay elevated. The spread between the two metals at 70:1 captures exactly that tension.
Historically, when the ratio expands past 70:1, silver tends to close that gap sharply once rate uncertainty resolves. After the COVID-19 peak of 127:1, silver outperformed gold by more than 70 percentage points within five months. The mechanism reverses cleanly — once growth and rate concerns ease, silver’s dual-engine structure amplifies the recovery rather than suppressing it.
Investors holding physical silver at a 70:1 ratio are effectively holding an asset the market is pricing as if economic slowdown is near-certain. That view may or may not prove correct. Nevertheless, it creates an entry point on the monetary side of silver that is historically favorable — without requiring any particular growth outcome to be right.
What Should Silver Investors Watch Next?
Two dates now define the near-term setup. July 28–29 is the FOMC decision. July 30 brings June PCE data, the Fed’s preferred inflation gauge. A hold at the July meeting, combined with a soft PCE print, would likely compress the gold-silver ratio. Conversely, any September hike signal would maintain the industrial-demand headwind on silver. Watch the 10-year Treasury yield as well: currently near 4.60%, a sustained move lower would ease real-yield pressure on both metals. Historically, silver responds at roughly 1.5 times gold’s magnitude on the upside.
Stay On Top of Gold & Silver Prices
Get important market alerts sent straight to your inbox.
SOURCES
1. GoldSilver — Live Silver Spot Price, July 15, 2026
2. GoldSilver — Live Gold Spot Price, July 15, 2026
3. Silver Institute — World Silver Survey 2026
4. Bureau of Labor Statistics — Producer Price Index, June 2026, July 15, 2026
5. CME Group — FedWatch Tool, July 2026 FOMC Rate Probabilities
6. Federal Reserve — Chairman Warsh Semiannual Monetary Policy Testimony, July 14–15, 2026
Disclaimer: This article is for informational purposes only and does not constitute financial or investment advice. Always consult a qualified financial adviser before making investment decisions.
You May Also Like:
- Gold Holds as CPI and PPI Both Miss. Here’s Why.
- Gold Is Flat. Oil Is Up 9%. Here’s Why.
- Gold and Fed Policy: When the System Picks Winners
- Warsh Testified. Gold Jumped $90. The Signal Everybody Missed Was in His Report.
- Gold Jumped $90 This Morning. June CPI Just Explained Why.
- Silver Fell 3.8% Today. Gold Fell 2.9%. The Gap Has a Name.