Silver Rises Over 120% YTD




Published: 09-01-2026, 02:21 pm
Silver’s supply deficit is about to enter its sixth straight year. Today, that fact bought it nothing.
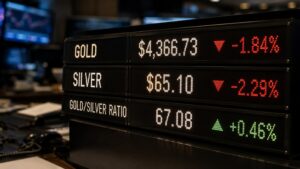
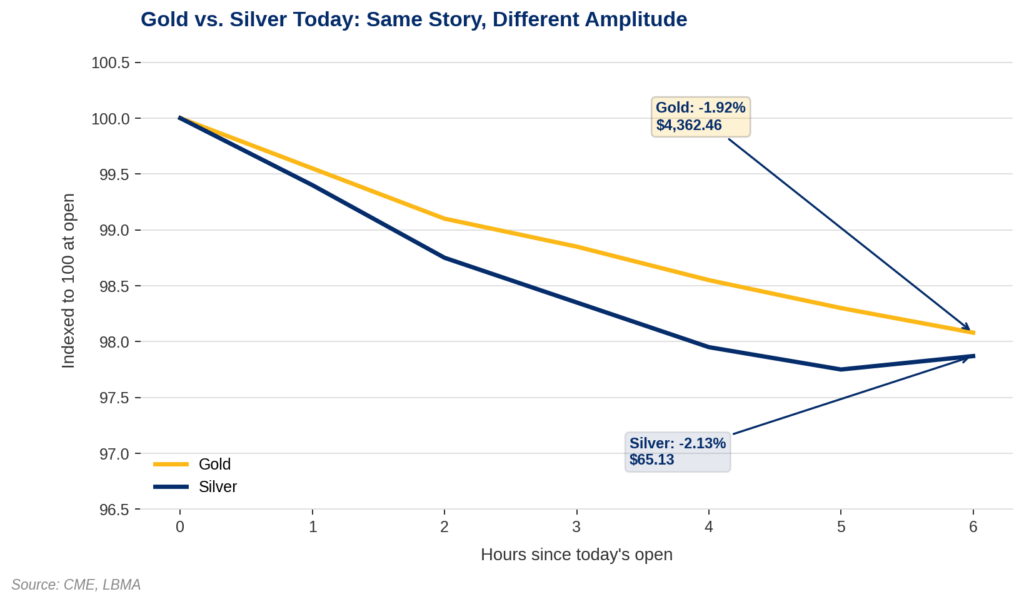
Gold is trading near $4,362 today, down 1.92% from this morning’s open. Silver is down more, at $65.13, off 2.13%. The gap between those two numbers is the real story. The gold-silver ratio widened from 66.84 at the open to 66.98. It now takes almost 67 ounces of silver to buy one ounce of gold, up from roughly 66.8 just hours earlier.
Why Are Gold and Silver Both Falling Today?
Neither move has anything to do with silver or gold specifically. Both prices are tracking the same lever: the odds of a Federal Reserve rate hike at the September 15-16 meeting. Those odds have climbed to somewhere between 60% and 66%, depending on which platform you check. CME FedWatch, Kalshi, and Polymarket don’t fully agree on the exact number. But all three show a sharp move, up from roughly 36% to 40% just a week ago, before Fed Chair Kevin Warsh’s Jackson Hole speech last Friday. The 10-year Treasury yield has followed suit, climbing to roughly 4.78% to 4.80%, its highest level since January 2025.
Rising real yields plus a stronger dollar is a textbook headwind for anything that pays no interest. Gold and silver both fall into that bucket. That single force is pushing both metals down today.

The Edge Every Investor Needs Smarter precious metals investing starts here. The Nuggets Newsletter brings you essential market insights, Fed updates, global trends, educational videos, and much more.
Why Is Silver Falling Faster Than Gold?
This is where the ratio move earns its keep. Silver pays no yield either, so in theory it should respond to a rate story the same way gold does. It isn’t. It’s responding more.
The mechanism is straightforward once you see it. Silver trades in a smaller, thinner market than gold. A much larger share of its daily volume ties to industrial and speculative positioning rather than long-term holding. That combination gives silver a structurally higher beta to real-rate moves, in both directions. When the rate story turns bullish for precious metals, silver typically outperforms gold, sometimes sharply. When it turns bearish, silver typically gives more of that ground back. Today is the bearish half of that pattern.
Did Silver’s Supply and Demand Picture Change Today?
No. And that’s the point worth sitting with.
The Silver Institute, in its World Silver Survey 2026 with Metals Focus, projects a 46.3 million ounce deficit for the year. That’s the sixth consecutive annual shortfall, widening from 40.3 million ounces in 2025. Total demand runs at 1,112.6 million ounces against total supply of 1,066.4 million ounces. None of that moved between yesterday’s close and today’s session. Electric vehicle demand, one of the more durable pieces of that structural case, keeps growing for reasons that have nothing to do with this week’s Fed commentary. A battery electric vehicle uses roughly 25 to 50 grams of silver, 67% to 79% more than a comparable gas-powered vehicle, according to a Silver Institute and Oxford Economics report from December 2025. That demand curve doesn’t reprice itself because Kevin Warsh gave a speech.
What Does Today’s Ratio Move Actually Tell You?
Not what it looks like. Treating today’s ratio move as information about silver’s investment case would be a mistake. It’s information about the Fed.
A saver deciding whether to buy silver on this dip is really asking two separate questions. Is the metal’s supply-demand structure sound? And is right now a good entry point given rate-driven weakness? Today’s price action has merged those into one number, but they deserve separate answers. The first question has an answer that hasn’t changed in months: a market running a deficit for six straight years and counting. The second question stays genuinely uncertain, tied to a Fed decision two weeks out and a jobs report Friday that could move the odds again either way. Mixing the two up, reading a rate-driven dip as evidence about the deficit, or using the deficit as a reason to ignore rate risk entirely, is how investors land on the right call for the wrong reason.
What Should Investors Watch Next?
Friday’s August jobs report comes first. It’s the next data point that can move September’s rate-hike odds before the Fed actually meets. A soft print would likely pull those odds back down and could reverse some of today’s move in both metals. A strong one would reinforce it. The September 15-16 FOMC decision itself is what actually resolves the question markets have spent all week pricing. Watch the gold-silver ratio around that date, not any single day’s print. That’s the cleaner read on whether silver’s structural case reasserts itself once the rate story settles down.
Stay On Top of Gold & Silver Prices
Get important market alerts sent straight to your inbox.
SOURCES
1. CME Group, FedWatch Tool
2. Polymarket, “Fed rate hike by…?” market data
3. Federal Reserve
4. Silver Institute and Metals Focus, World Silver Survey 2026
5. Silver Institute and Oxford Economics, “Silver, The Next Generation Metal” (December 2025)
6. LBMA
Disclaimer: This article is for informational purposes only and does not constitute investment advice. Past performance is not indicative of future results. Always consult a qualified financial advisor before making investment decisions.
You May Also Like:
- Wall Street Keeps Buying Gold. Washington Keeps Sending Mixed Signals.
- Iran’s Gold Sector Just Got Named in U.S. Sanctions. Gold Is Selling Off Anyway.
- Hike Odds Doubled This Week. Real Yields Didn’t.
- COMEX Registered Gold Just Fell Below 15 Million Ounces. It’s Still Refilling.
- Gold Isn’t Falling on a Hawkish Fed. Here’s Why.
- Gold and Silver Sink as Warsh Cites AI Boom to Justify More Fed Tightening
- Five Things Moved Gold and Silver This Week. Only One Was Kevin Warsh.