The Fed Just Killed Its Rate Roadmap. Here’s What That Means for Gold.
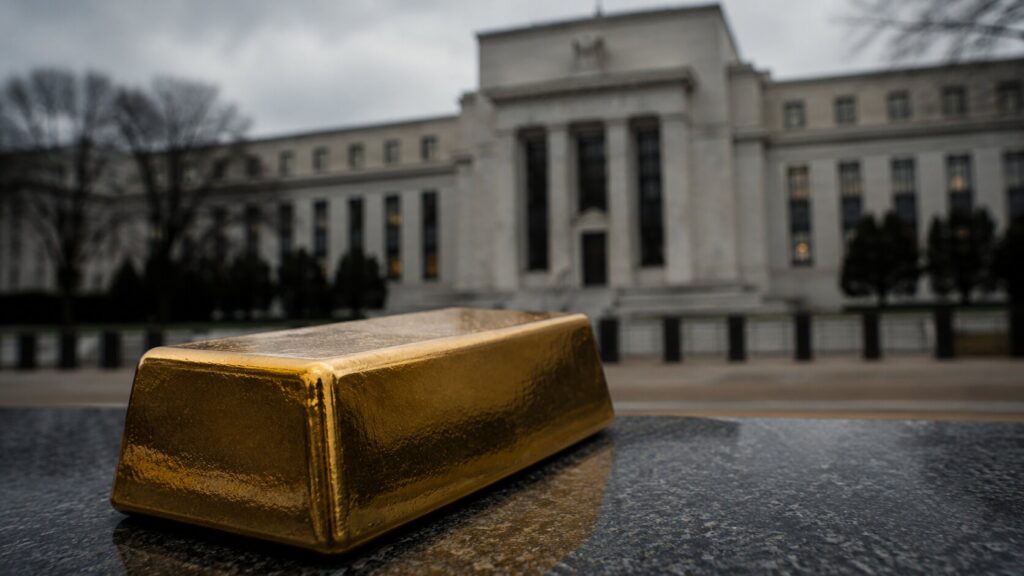
The Fed held rates steady. That wasn’t the story. Kevin Warsh withheld his dot plot entry — the first Fed chair in 14 years to do so — and quietly ended the forward guidance era that has guided markets since 2012. Here’s what that shift means for gold.
Why Is Silver Up Today? The Iran Deal Changed the Fed Math
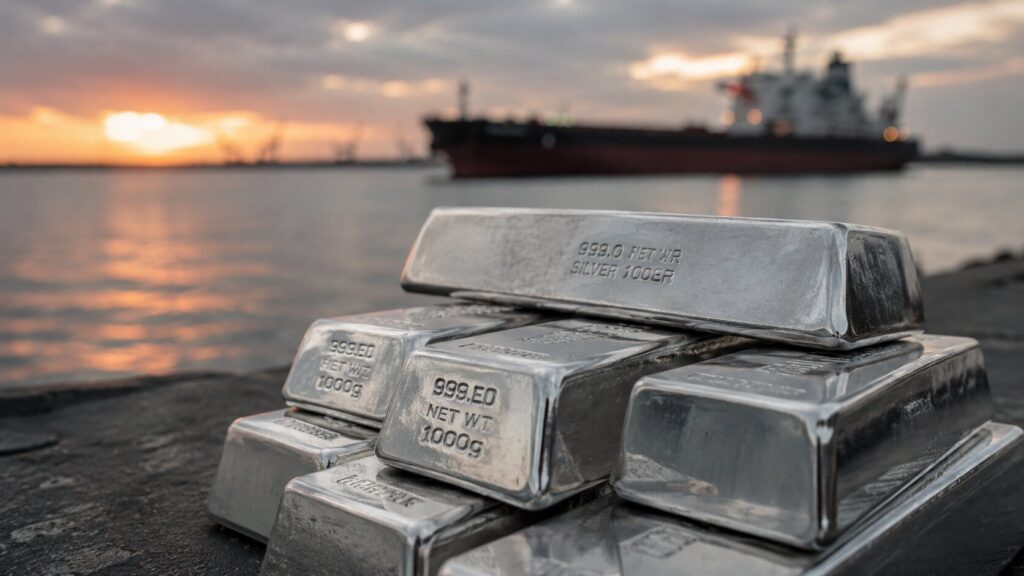
Silver is up while oil burns down. Most headlines are calling it a peace trade. They have the mechanism backwards. The real driver isn’t the war ending — it’s what cheaper oil does to Fed rate-hike expectations, real yields, and silver’s opportunity cost. Here’s the chain most coverage is missing.
Iran Peace Deal Sends Oil Down 5%, Gold Up 3%
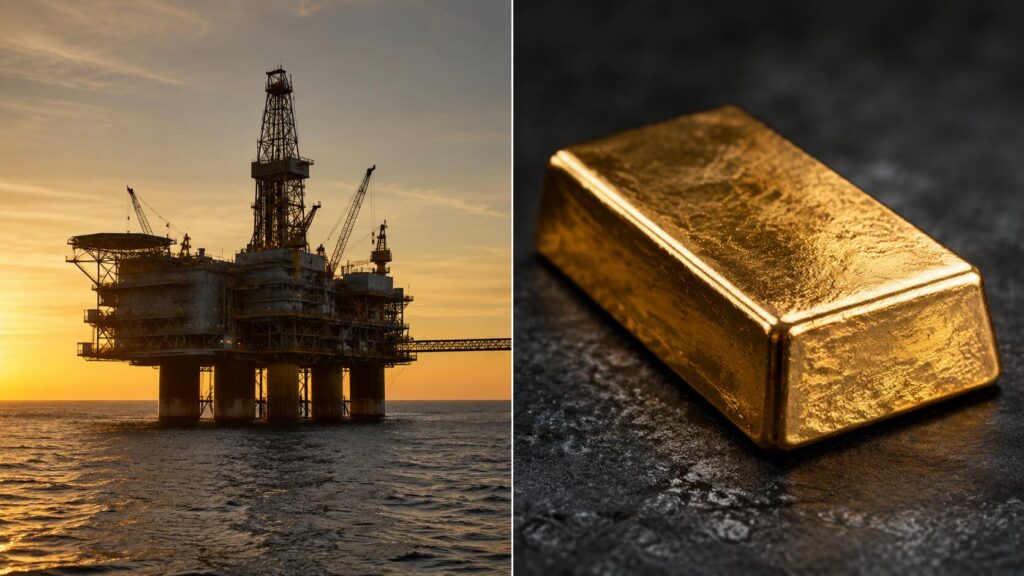
The Iran peace deal was supposed to hurt gold. It didn’t. Here’s why oil falling 5% is pushing gold higher — and what that tells long-term holders about the monetary chain driving precious metals right now.
Wall Street’s $6,000 gold call rests on data most investors never see
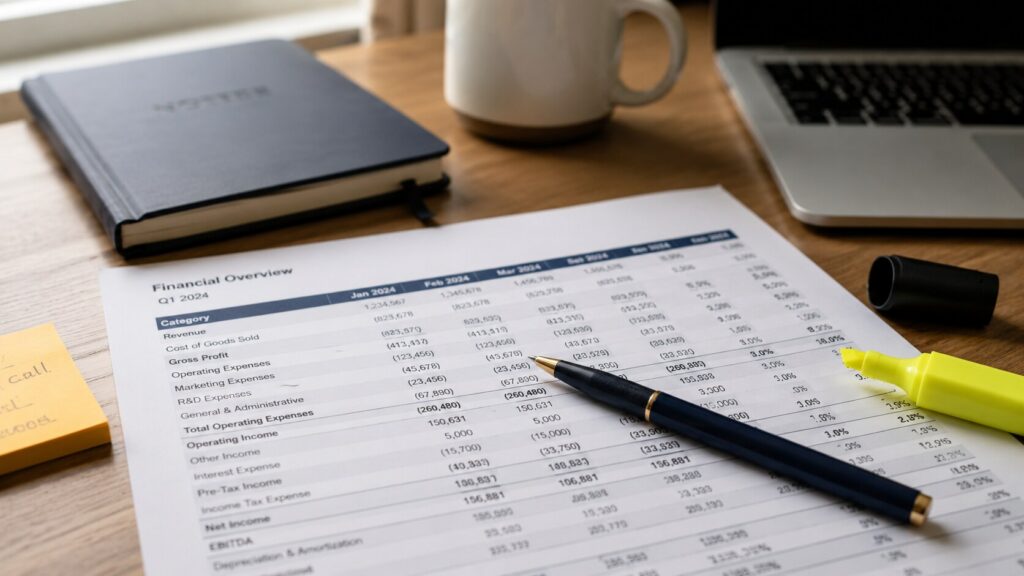
Wall Street’s $6,000 gold forecast isn’t built on the price target — it’s built on a central bank buying figure most investors never see. Official IMF data shows 16 tons of net purchases in Q1 2026. The World Gold Council estimates the real figure at 244 tons. That gap is the story.
Gold & Silver Surge on Iran Peace Deal — Then Pull Back

Gold and silver surged Friday on Iran peace deal hopes, then pulled back. The real story is the oil drop — and the inflation chain it may be unwinding. Here’s the mechanism behind today’s move and what it means heading into the Fed’s first meeting under Kevin Warsh on June 16–17.
Silver Fell 22% in 30 Days. Gold-Silver Ratio Hits 63.
Over the past 30 days, silver has fallen more than twice as fast as gold. The gold-silver ratio now sits at 63 — up more than 8 points in a month. That move has a name, a mechanism, and a track record. Here is what drove it, and what comes next.
How Gold Price Is Set: The East-West Tide Explained

For 90 years, gold has moved in a recurring tide between Western financial markets and Eastern physical holders. Understanding who sets the price — and why that mechanism is shifting — is the most useful mental model a gold investor can carry.
Gold Is Down 9%. The CPI Print That Could Either Extend the Drop — or End It.
Gold is down 9% from its April high near $4,800. Two forces drove the pullback: the Iran–Israel ceasefire unwound the geopolitical risk premium, and a blowout jobs report pushed Fed rate-hike odds to 68–70% by December. The May CPI print is the next catalyst. Here’s the mechanism behind the move — and what each scenario means for physical holders.
Gold Price News: Goldman, China, CPI, and the Fed Explained
Goldman Sachs just pushed every 2026 rate cut to 2027. China’s central bank bought gold for the 19th month in a row. CPI drops Wednesday. A fragile ceasefire is holding — barely. And silver just had its worst week relative to gold in months. Here is what each story means for precious metals investors.
Does Physical Gold Have Counterparty Risk? The Facts
When you deposit money at a bank, you are not storing it. You are lending it. Physical gold counterparty risk is zero because allocated metal is not a claim on any institution — it cannot be frozen, diluted, or devalued by policy. This explainer covers the mechanism and how to structure both approaches correctly.
