When the U.S. stock market lost nearly 90% of its value during the Great Depression, one asset held its ground — and then some. Gold didn’t just survive the worst economic collapse in modern history. It was repriced upward by 69% as the government acknowledged what markets already knew: paper money had been overvalued relative to gold.
That episode set a pattern that has repeated across every major recession since — and understanding gold performance during recessions is one of the most useful things an investor can do before the next downturn arrives.
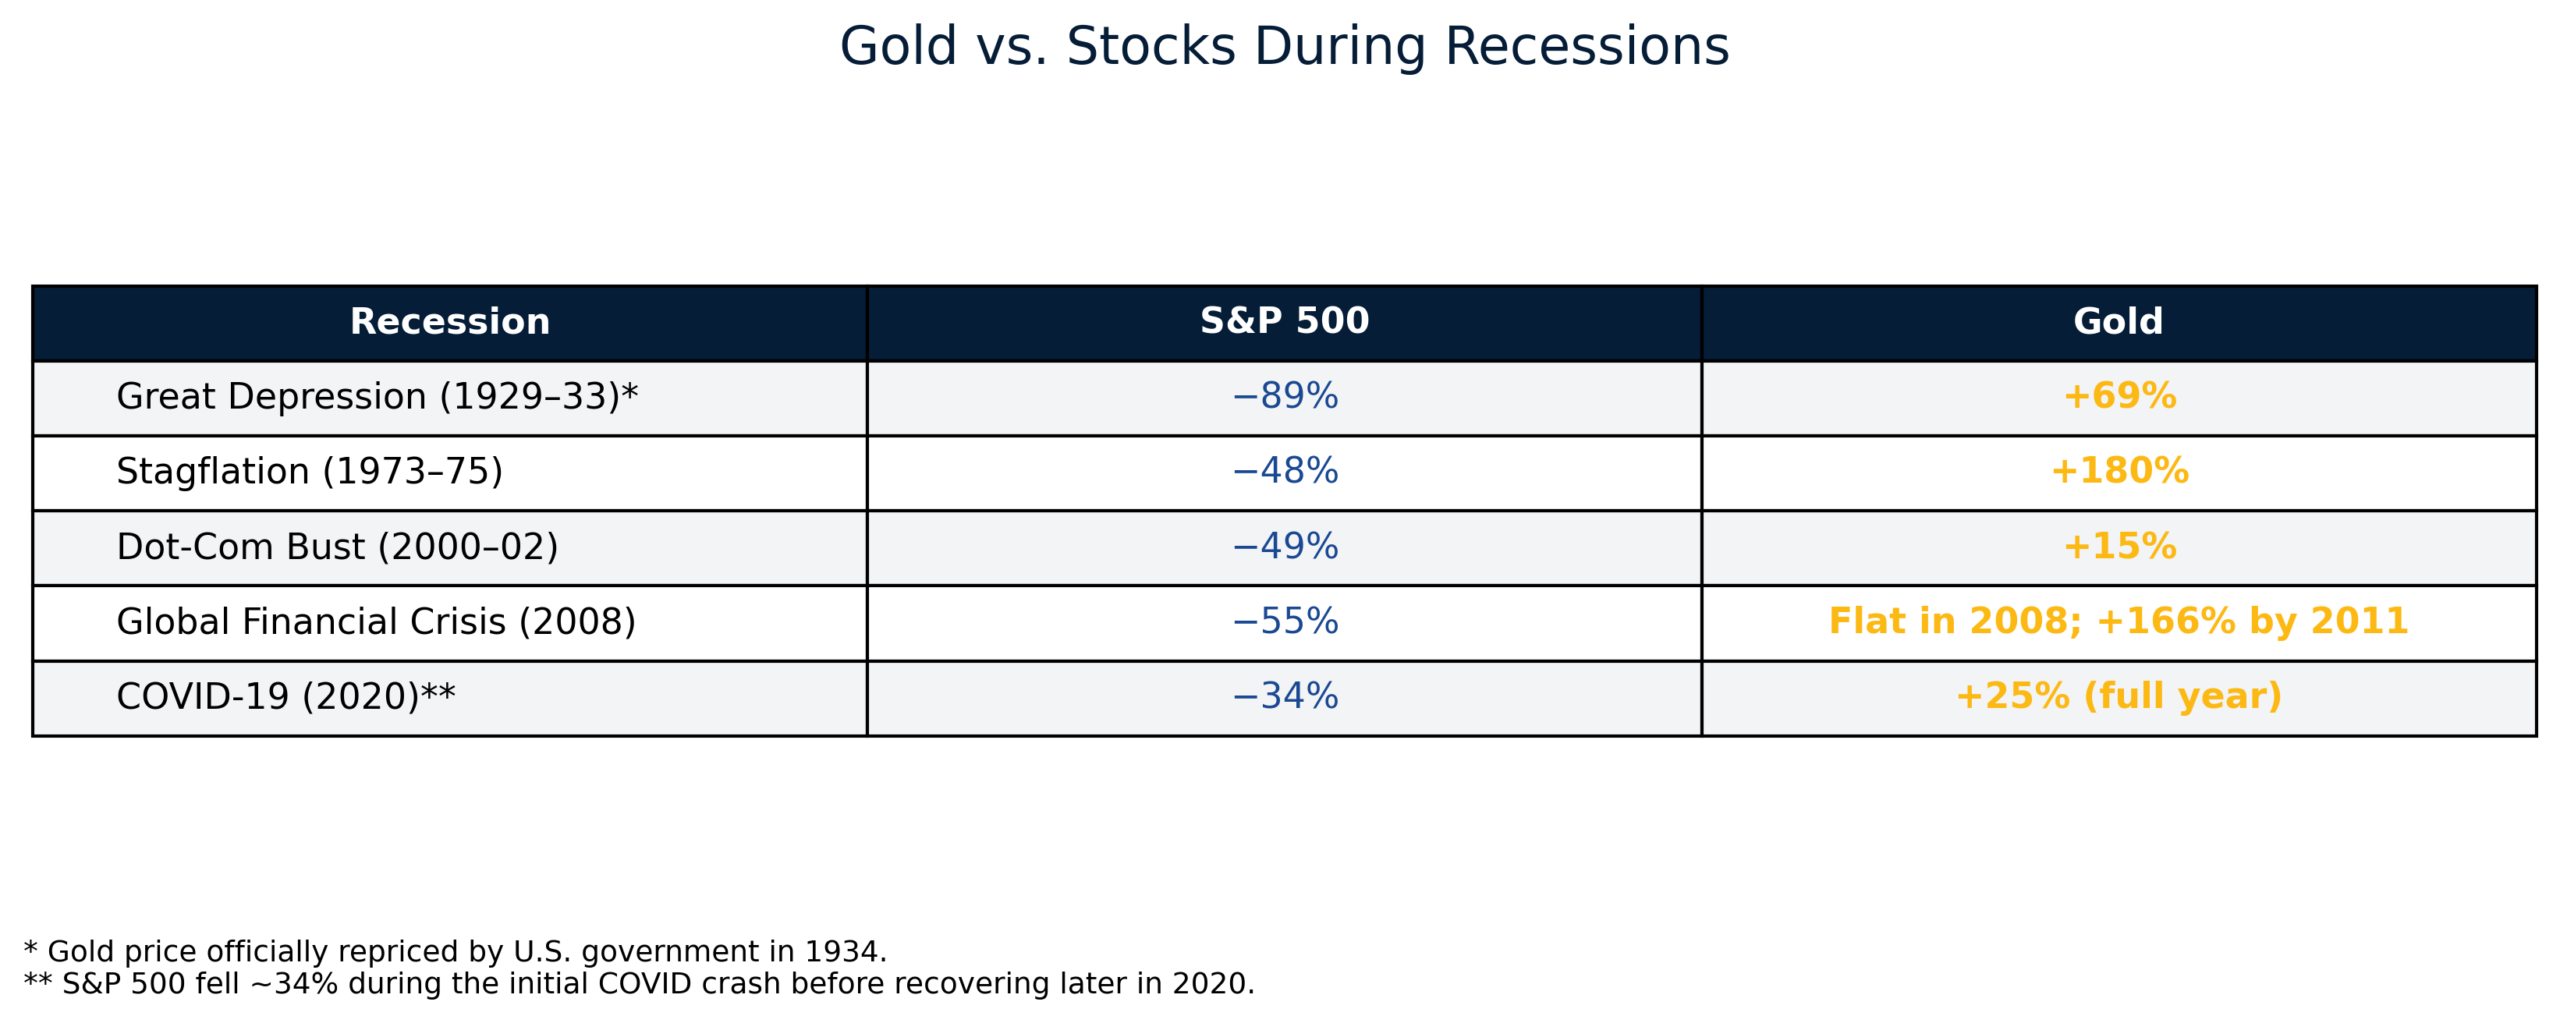
Gold vs. the Stock Market: A Side-by-Side View
Gold returns shown as peak recession-period performance. 2008 S&P figure reflects peak-to-trough loss; gold shown flat for 2008 calendar year. 1929–33 gold reflects government repricing.
But does gold’s safe-haven reputation hold up under scrutiny, or is it more folklore than fact? To understand the pattern, you need to understand what actually drives gold during downturns — and why the relationship is more reliable than most investors realize.
The Financial System Isn’t Safer — And You Know It As risks mount, see why gold and silver are projected to keep shining in 2026 and beyond.
What Actually Drives Gold During Recessions
To understand gold performance during recessions, start with what actually drives the price. A recession is commonly defined as two consecutive quarters of negative GDP growth — though the NBER, the official U.S. recession-dating body, uses a broader set of indicators.
First, governments respond to downturns with stimulus spending and looser monetary policy. That erodes the purchasing power of fiat currencies. Gold, which can’t be printed or debased, becomes comparatively more valuable. Second, central banks cut interest rates aggressively during recessions, reducing the opportunity cost of holding a non-yielding asset like gold. When cash and bonds pay almost nothing, gold’s lack of yield matters less. Third, fear itself drives demand. Gold is partly a sentiment trade, and recessions produce sentiment in abundance.
None of these forces operate in isolation — they reinforce each other. The result is a consistent pattern across history.
The Great Depression (1929–1933)
The U.S. stock market lost nearly 90% of its value between 1929 and 1932. Gold was fixed at $20.67 per ounce under U.S. law, but President Roosevelt’s Gold Reserve Act of 1934 repriced it to $35 — a government-mandated 69% increase that acknowledged the dollar’s effective debasement. Investors holding gold-backed instruments or gold mining stocks saw exceptional returns while virtually every other asset class collapsed.
The 1970s Stagflation Crisis
The early 1970s recession wasn’t driven by a financial collapse but by an oil shock combined with runaway inflation — stagflation. It proved to be one of gold’s finest hours. After Nixon severed the dollar’s link to gold in 1971, the metal was free to trade at market prices. From 1971 to 1980, gold surged from approximately $35 per ounce to over $800 — a gain exceeding 2,000%. During the 1973–1975 recession specifically, gold appreciated sharply while equities fell 48%. This period established gold’s modern identity as both an inflation hedge and a recession hedge.
The 2001 Dot-Com Recession
When the tech bubble burst and the U.S. entered recession in 2001, gold was already in the early stages of what would become a decade-long bull market. As the S&P 500 fell roughly 40% between 2000 and 2002, gold climbed from around $270 per ounce to over $310 — a gain of approximately 15%. The September 11 attacks amplified geopolitical uncertainty and further boosted gold’s appeal, demonstrating that safe-haven demand extends beyond financial crises to geopolitical shocks as well.
The 2008 Global Financial Crisis
The 2008 crisis is the most instructive modern case study. When Lehman Brothers collapsed in September 2008, markets went into freefall and the S&P 500 ultimately lost more than 50% from peak to trough.
Gold’s behavior was nuanced. In the immediate panic of late 2008, it dipped briefly alongside other assets as investors sold everything to raise cash. But the recovery was swift. Gold entered 2008 at around $850 per ounce and closed the year at approximately $870 — essentially flat during the worst year for equities in decades. From those lows through its 2011 peak, gold surged to over $1,900 per ounce as quantitative easing and near-zero interest rates played out across the global economy.
The brief dip in late 2008 is worth understanding: it wasn’t a failure of gold as a hedge. It was a liquidity crunch. Investors who held through it captured the full recovery and then some.
The COVID-19 Recession (2020)
The pandemic-induced recession of 2020 was the sharpest GDP contraction in U.S. history. Gold responded accordingly: from the start of 2020 to its August peak, it climbed from around $1,520 to over $2,070 per ounce, a gain of more than 36%. For the full year, gold rose 25.1% while silver surged 47.9%. This period showed how quickly gold can respond to crisis conditions — and how it can sustain gains well after the initial shock.
What the Data Actually Tells Us
Over 90 years of recession data, gold has shown four consistent characteristics during downturns.
It preserves purchasing power. Even when gold doesn’t surge in nominal terms, it tends to hold its value relative to currencies being debased through stimulus and low rates. It benefits from rate cuts — the Federal Reserve’s tendency to slash interest rates during recessions directly reduces the opportunity cost of holding gold. It responds to fear, and recessions produce fear reliably. And it isn’t perfectly correlated with stocks, which is precisely what makes it useful as a portfolio hedge rather than a speculation.
The brief liquidity crunches seen in late 2008 and March 2020 — when gold dipped alongside everything else — are worth noting. Patient investors who understand this dynamic aren’t rattled by short-term dislocations. They’re positioned to benefit when gold recovers, which it has done every time.
How Much Gold Should You Hold Before a Recession?
Most financial advisors suggest allocating between 5% and 15% of a portfolio to precious metals, calibrated to risk tolerance. Conservative investors often target 8–10% in gold with a smaller silver allocation, prioritizing stability. Moderate investors might balance gold and silver more evenly — 5–8% gold, 3–5% silver — for a mix of stability and upside exposure. More aggressive investors may tilt toward silver given its higher volatility on recoveries, while maintaining a core gold position.
The timing challenge is real. By the time a recession is officially declared, gold has often already advanced. Dollar-cost averaging — buying fixed amounts at regular intervals — lets investors build a position gradually without trying to call the market.
The Bottom Line
History doesn’t guarantee future performance. But it does establish patterns worth taking seriously. Across every major recession of the past century — from the Great Depression to the COVID-19 contraction — gold has demonstrated a consistent ability to preserve wealth when other assets are under severe pressure.
Its role isn’t to make investors rich overnight. It’s to provide a stable foundation when the financial system is under stress. For investors still asking whether gold belongs in their portfolio before the next recession, the historical record answers the question: it already has, in every major downturn on record.
Investing in Physical Metals Made Easy

People Also Ask
Does gold go up during a recession?
Gold often holds its value or rises during recessions. During the 2008 financial crisis, gold stayed roughly flat while the S&P 500 fell over 50%. It then surged 166% by 2011. In 2020, gold gained about 25% for the year.
Why does gold increase in value during economic downturns?
Three forces often push gold higher in recessions. Central banks cut interest rates, reducing the cost of holding gold. Governments add stimulus, which raises inflation concerns. Investor fear also boosts demand for safe-haven assets.
What was the gold price during the 2008 recession?
Gold started 2008 near $850 per ounce and ended the year around $870. That made it essentially flat while many other assets collapsed. By 2011, gold had climbed above $1,900.
How does gold compare to stocks during a recession?
Gold and stocks have historically moved in opposite directions during major downturns. During the dot-com bust, the S&P 500 fell 49% while gold gained 15%. During the 2008 crisis, stocks lost 55% peak to trough while gold finished the year flat. This low correlation is precisely why financial advisors recommend gold as a portfolio diversifier.
Is gold a reliable investment during a recession?
Based on over 90 years of recession data, gold has consistently preserved purchasing power during economic downturns. It often outperforms relative to equities in every major recession from the Great Depression to COVID-19. While short-term volatility is possible, gold’s long-term track record as a recession hedge is well-supported by historical evidence.
This article is for informational purposes only and does not constitute financial or investment advice. Past performance is not indicative of future results. Consult a qualified financial advisor before making investment decisions.