Silver doesn’t do anything quietly.
The metal began 2026 around $71 per ounce, then surged past $110 and eventually hit an all-time high near $121.67 in January. It was one of the most explosive moves in silver’s history.
Then came the crash.
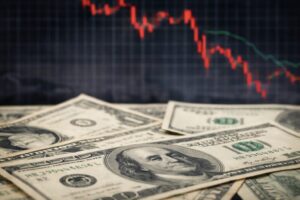
On January 30, 2026, silver suffered one of its largest single-day drops on record — falling roughly 30% after the CME Group raised margin requirements on futures contracts, triggering a wave of forced liquidations. The metal bottomed near $74, wiped out billions in paper profits, and left investors scrambling to make sense of what had just happened.
For anyone who bought silver expecting a straight-line march to $150, the drop felt catastrophic. But if you’ve studied silver price crash history, it looked like something else entirely: business as usual.
The Financial System Isn’t Safer — And You Know It As risks mount, see why gold and silver are projected to keep shining in 2026 and beyond.
Why Is Silver So Volatile?
Silver moves faster than gold and faster than most commodities. It moves in both directions, often sharply. That volatility isn’t a character flaw. It’s what creates the outsized gains that make silver worth holding in the first place.
Part of the reason comes down to market size. The entire global silver market is a fraction of the gold market — and a rounding error compared to equities or bonds. That means relatively small flows of capital can move the price dramatically. When a large institution decides to buy or sell, there simply isn’t enough market depth to absorb it quietly. The price moves instead.
The metal also sits at the intersection of two distinct demand pools. The first is monetary: investors seeking a hard-money hedge against inflation and currency debasement. The second is industrial: manufacturers who need silver for solar panels, EVs, electronics, and medical devices. When both forces pull in the same direction, silver can surge violently. When sentiment shifts — especially when leveraged futures positions unwind — it can fall just as fast.
That second scenario is exactly what happened in January 2026.
But here’s what decades of silver history consistently show: the biggest single-day crashes almost always happen inside bull markets, not at the end of them. Volatility is the price of admission. The investors who get shaken out during the drops are the ones who miss what comes next.
Has Silver Ever Crashed This Hard in a Bull Market Before?
The 1970s bull market is the benchmark for precious metals investors. From 1970 to early 1980, silver climbed from roughly $1.29 to $50 per ounce — a gain of more than 38 times.
It was not a smooth ride.
From late 1973 into early 1974, silver surged 125% in just a few months. That rally marked the end of the first leg of the bull market. Over the next two years, silver fell roughly 45%.
Forty-five percent. Many investors who bought near the 1974 peak couldn’t stomach the volatility and sold during the correction locked in major losses. Many never came back to the market. The investors who held — or bought more — were eventually rewarded with silver’s most explosive phase: the parabolic move from 1978 to 1980 that took the metal to $50.
Silver’s 1970s Bull Market: Surge, Correction, and Parabolic Finale
Price per troy ounce · USD · 1970–1980
Silver climbed from $1.29 to $50 — a 38× gain. But the path included a 45% correction that shook out most investors before the biggest gains arrived. Select a phase above to explore each stage.
The bull market lasted approximately 10 years and ended only when Fed Chairman Paul Volcker dramatically raised interest rates. Positive real rates made holding non-yielding assets less attractive — and that, finally, broke the bull market.
Not a correction. Not a margin-driven crash. A fundamental reversal of the macro environment.
That distinction matters enormously right now. The 1974 correction looked like the end. It wasn’t. What eventually ended the bull market was something different entirely: a Fed willing to cause a recession to kill inflation. That’s not today’s Fed.
The correction was the intermission. The real show came after.
Did the 2011 Silver Crash Signal the End of the Bull Market?
Not every correction is a buying opportunity. 2011 is worth examining honestly — because the bulls who dismissed that crash were wrong.
Silver peaked near $49.82 in April 2011 and collapsed. Between late April and early May, the CME raised margin requirements on silver futures multiple times — by more than 80% cumulatively within weeks. Forced liquidations were severe. Silver fell more than 30% in just over a month.
The mechanism looked familiar. But the context was completely different from today.
The Fed’s quantitative easing programs were ending. Real interest rates began rising. The US dollar strengthened. The macro forces that had powered silver’s run weren’t pausing — they were reversing. Silver spent the next several years working off that excess, eventually bottoming near $14.
That’s the real lesson from 2011. The crash didn’t cause the bear market. The reversal of the underlying macro environment did. The margin hikes just accelerated what was already inevitable.
Which raises the obvious question: are today’s macro drivers reversing — or intact?
Is the 2026 Silver Crash More Like 1974 or 2011?
The January 2026 crash had the same mechanical fingerprints as 2011 — margin hikes, forced liquidations, paper silver sold faster than physical buyers could absorb it. The mechanism was identical. The environment was not.
In 2011, the Fed was tightening. Real rates were rising. The monetary response to the 2008 financial crisis was being unwound. Silver’s tailwinds weren’t pausing — they were gone.
In 2026, none of that applies.
Supply deficits in physical silver remain structural. Industrial demand from solar, EVs, and AI hardware continues to grow. Physical inventories have been depleted. The Fed has not pivoted to the kind of positive real rates that historically end precious metals bull markets. Analysts say the sharp swings in early 2026 were driven primarily by positioning — not a sudden shift in the metal’s long-term fundamentals. A positioning unwind is painful. It is not a verdict on the trade.
Peter Brandt — who had predicted the January drop — turned bullish after the crash, writing: “2026 is NOT 2011. In my mind, the 2011 rally was destined to return back to the teens. Not this time.”
He’s not alone in that view. The investors exiting silver right now are making a macro call — that the forces driving this bull market have reversed. The data doesn’t support that conclusion.
What Has Historically Happened to Silver After a Major Crash?
The historical pattern is consistent. After violent corrections within a bull market, silver resumes its upward trend. The investors who sold into panic are the ones who look back with regret.
After the 45% correction from 1974 to 1976, silver didn’t just recover. It delivered its biggest percentage gains of the entire decade — the parabolic move to $50 that defined the era.
After a sharp pullback in August 1979, triggered by early margin concerns, silver recovered quickly. It went on to hit its all-time high just months later.
Two crashes. Two recoveries. The same underlying logic both times: the structural forces driving the bull market hadn’t changed, so the price eventually reflected that.
The pattern isn’t that corrections don’t happen. They always do — and in silver, they tend to be brutal. The pattern is that in a genuine bull market, one driven by real monetary and industrial forces rather than pure speculation, selling into the drop is almost always the wrong call.
What This Means for Silver Investors Today
Silver at $78 per ounce (as of mid-March 2026) is still up more than 150% over the past year. The metal has pulled back roughly 35% from its January peak — a sharp correction, but not unusual for silver in a bull market.
The investors most at risk right now aren’t the ones holding through volatility. They’re the ones selling into it. Exiting after a 30% drop to avoid further losses has historically been one of the most reliable ways to miss the next leg higher.
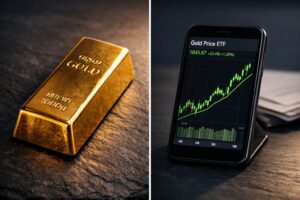
Deutsche Bank has raised the possibility of silver reaching $100 by year-end, arguing that silver tends to outperform gold in the later stages of a metals bull cycle.
That’s not a guarantee. Silver is volatile, and that cuts both ways. Holding silver means accepting sharp, uncomfortable swings in exchange for the potential of outsized long-term gains. Anyone who can’t stomach that should size their position accordingly.
But the historical record is clear. The investors who recognized the 1974 correction as a shakeout — not a verdict — were rewarded. The ones who sold locked in losses and missed the decade’s biggest gains.
Silver will be volatile again. That’s certain. What matters is whether you understand why you own it — and whether your conviction is built on the fundamentals, not the price action.
Investing in Physical Metals Made Easy

People Also Ask
Why did silver drop 20% so quickly in 2026?
Silver surged rapidly above $100/oz, which often leads to sharp corrections as traders take profits and leveraged positions unwind. These fast pullbacks are common after explosive rallies.
Is a 20% drop in silver a sign the bull market is over?
Not necessarily. Historically, silver has experienced multiple 20%+ corrections during strong bull markets, including the 1970s run. These pullbacks often reset the market before the next move higher.
Has silver crashed like this before in a bull market?
Yes—many times. During the 1970s bull market, silver saw repeated 15–30% drops, even as prices ultimately surged 30x higher. These corrections shook out weak investors but didn’t stop the long-term trend.
What usually happens after a big silver correction?
After sharp declines, silver often stabilizes and resumes its upward trend if the underlying fundamentals remain intact. Corrections can create new entry points for investors who understand the cycle.
Why is silver more volatile than gold?
Silver has a smaller market size and is influenced by both monetary demand and industrial use. This makes it more sensitive to speculation and economic shifts, leading to larger price swings. That volatility can be challenging—but also creates opportunity when understood properly.