Published: 03-31-2026, 01:55 pm | Updated: 03-31-2026, 01:49 pm
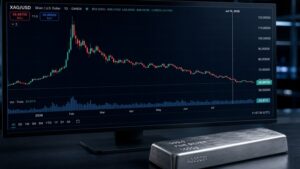
Silver moves fast. In 2025, it gained over 150% while gold climbed roughly 66%. In previous cycles, it has crashed just as dramatically. That pattern isn’t an accident—it’s a direct result of how the silver market is built.
The most important factor? Size.
How Big is the Gold Market Compared to the Silver Market?
Gold’s total above-ground stock is estimated at roughly 216,000 tonnes. At current prices near $4,166 per troy ounce, the world’s above-ground gold is valued at approximately $29 trillion. Visual Capitalist
Silver’s total above-ground market cap sits at around $3.9 trillion.
That gap is enormous. Gold’s market is nearly 8 times larger than silver’s. And market size matters more than most investors realize.
at ~$4,166/oz (2025)
consumed by industry
What Does Daily Trading Volume Reveal About Each Market?
Market cap is one lens. Daily liquidity is another—and it tells an even sharper story.
In 2024, gold trading volume averaged $227 billion per day, up 39% from 2023. That’s comparable to the daily trading of some of the world’s biggest currencies. GoldSilver
Silver’s liquidity is a fraction of that. Over the past five years, gold ETFs have averaged $2.3 billion per day versus $0.7 billion for silver. The gap widens in futures ($55 billion vs. $11 billion) and OTC trading ($97 billion vs. $13 billion). World Gold Council
Combined across all three segments, gold trades roughly six times more volume per day than silver.
Futures $55B
ETFs $2.3B
Futures $11B
ETFs $0.7B
Why Does a Smaller Market Produce Bigger Price Swings?
Think of it this way: a large order moving through a deep market barely ripples the surface. The same order in a shallow market creates waves.
Gold trades in a deeper, more liquid market, with tighter spreads and far lower volatility than silver. World Gold Council When investor sentiment shifts—toward risk or away from it—capital flows in and out of silver with outsized effect. There simply isn’t enough market depth to absorb the move quietly.
This is the core mechanic behind silver’s volatility. It’s not irrational. It’s math.
Does Silver’s Industrial Demand Make It More Volatile?
Yes — and in a distinct way from gold. Silver carries a dual identity. It trades as a monetary metal alongside gold, but it also serves as an industrial input. Solar panels, electric vehicles, semiconductors, and medical equipment all depend on silver. Silver’s more industrial-heavy demand base, smaller market depth, and wider spreads contribute to higher volatility and more cyclical performance, while also making it more sensitive to commodity index flows. World Gold Council
When the global economy slows, industrial demand contracts—and silver feels it. Gold’s industrial exposure is minimal by comparison. That’s one reason gold tends to hold value during recessions while silver can track both commodity cycles and monetary sentiment simultaneously.

How Has Silver’s Volatility Compared to Gold Historically?
The pattern has been consistent across cycles. Silver has been more volatile and cyclical. While it has not consistently provided the same benefits as gold, silver can help enhance diversification over full market cycles by offering greater upside potential during periods of economic expansion, reflation, and industrial growth. BlackRock
Put differently: silver tends to be a high-beta play on the same drivers that move gold. When gold rises, silver usually rises more. When gold falls, silver typically falls harder. Silver historically exhibits higher beta than gold. While gold acts as a stabilizer, silver tends to outperform during reflationary cycles and periods of monetary easing. BingX
That dynamic played out clearly in 2025. Gold surged roughly 66%. Silver exceeded 150%.
What Does Silver’s Volatility Mean for Investors?
Volatility isn’t inherently bad. It’s context-dependent. For investors seeking stability and capital preservation, gold’s deep liquidity and lower volatility make it the more reliable anchor. Given its higher volatility, the sizing of a silver position within a portfolio has often been smaller than that for gold. BlackRock
Silver plays a different role. Silver can complement gold tactically for investors seeking a higher-beta alternative, but it is not a like-for-like substitute for gold’s strategic role. World Gold Council
The classic approach: use gold as the foundation, silver as a satellite. Gold provides the floor. Silver provides the leverage—in both directions.
Understanding why silver moves the way it does doesn’t make the swings disappear. But it does make them easier to anticipate—and position around.
Stay On Top of Gold & Silver Prices
Get important market alerts sent straight to your inbox.
People Also Ask
Why is silver more volatile than gold?
Silver trades in a much smaller, less liquid market than gold — roughly 6 times less daily volume. That means any significant buying or selling pressure moves the price further and faster than it would in gold’s deeper market.
How big is the silver market compared to the gold market?
Gold’s total above-ground stock is valued at approximately $29 trillion, while silver’s sits around $3.9 trillion — making gold’s market nearly 8 times larger. That size gap is the primary reason the two metals behave so differently as investments.
What is the daily trading volume of gold vs. silver?
Gold averaged $227 billion in daily trading volume in 2024, spanning OTC markets, futures, and ETFs. Silver’s comparable daily volume across those same segments runs around $25 billion — a fraction of gold’s liquidity.
Does silver’s industrial use make it more volatile?
Yes. Unlike gold, silver is a critical industrial input used in solar panels, electric vehicles, and semiconductors. That means silver’s price can be pulled by both monetary sentiment and shifts in global economic demand — two forces that don’t always move together.
Is silver a good investment if it’s more volatile than gold?
Silver’s volatility cuts both ways — it tends to outperform gold during bull markets and underperform during downturns. Investors often hold a smaller silver position alongside gold to capture upside potential without overexposing their portfolio to the swings.
Sources
World Gold Council — Gold Trading Volumes (2024)
World Gold Council — Gold Safe Haven vs. Silver Wildcard (March 2026)
Visual Capitalist — Visualizing the World’s Total Supply of Gold (2025)
CompaniesMarketCap — Market Cap of Silver (2025)
BlackRock — Gold & Silver: Prices, Volatility, What’s Next (2025)
Silver Institute — World Silver Survey 2025
GoldSilver.com — Gold Trading Volume: Why $227 Billion Daily Trades Matter for Investors
This article is for informational purposes only and does not constitute financial or investment advice. Always consult a qualified financial advisor before making investment decisions.