Silver Rises Over 120% YTD


Published: 11-03-2026, 09:12 am
Last verified November 2026.
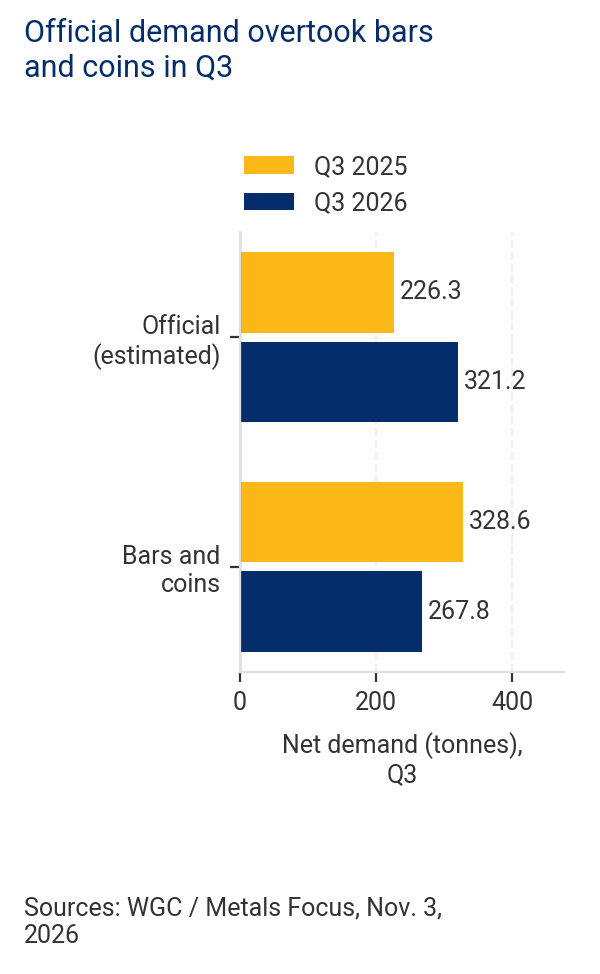
Central bank gold buying rose 42% in Q3 2026 from a year earlier, while bar-and-coin demand fell 19%. The gold-industry World Gold Council’s November 3, 2026, report puts estimated official net demand at 321.2 tonnes and bar-and-coin investment at 267.8 tonnes. The split illustrates different buyer priorities, not a forecast of gold’s next move.
These numbers cover July to September, not purchases made on November 3. In Q3 2025, official net demand was 226.3 tonnes. Bars and coins drew 328.6 tonnes. The same report gives both years’ figures, so we can compare each group with itself.
Key Takeaways
- The World Gold Council’s November 3, 2026, report puts Q3 estimated official net demand at 321.2 tonnes, up 42% from a year ago. Only 120 tonnes came from reported net buying.
- Global bar-and-coin buying fell 19% to 267.8 tonnes in Q3, but gold-backed funds added 211.2 tonnes. Not all private gold buyers pulled back.
- The council points to reserve risk management and price-sensitive private buyers. Neither the official total nor the gap between buyers sets a floor under gold.
How much central bank gold buying was reported?
Reported net purchases were 120 tonnes, says the council’s November 3 central-banks chapter. Yet its estimate for all official net demand is 321.2 tonnes. That category covers central banks and other official buyers. Roughly 63% of the total was absent from country reports. The gap reflects estimated unreported buying, not a list of named buyers. Late reports may also change the tally.
That is not the same yardstick as our October 16 report on disclosed August purchases. That story gave 39 tonnes for August based on public reports. The Q3 estimate spans the whole quarter and includes buying not in those reports. You cannot add the two totals.

The Edge Every Investor Needs Smarter precious metals investing starts here. The Nuggets Newsletter brings you essential market insights, Fed updates, global trends, educational videos, and much more.
Why did bars and coins lag?
The council’s November 3 investment chapter cites gold prices with no clear trend, bets on higher US rates for longer and rising stocks. It offers an account of weaker bar-and-coin buying, not proof of every buyer’s motive. A saver who can earn interest on cash may put off buying a bar that pays none.
US bar-and-coin buying fell to 8.2 tonnes from 13.5 a year earlier. That is a 40% drop in this category. Yet the global tally for January through September reached 1,053 tonnes. The council calls it the strongest such stretch since 2013. A soft quarter does not erase earlier purchases.
Did all private gold buyers pull back?
No. Physically backed gold exchange-traded funds, or ETFs, added 211.2 tonnes to their holdings in Q3. In the same November report, the Q2 figure is a 47.3-tonne outflow. Our July 31 report on Q2 bank and ETF buying used an earlier release. Its numbers should not be mixed with the November tally. Fund holdings rose in Q3 while bar-and-coin buying fell. These are distinct types of private gold demand.
Total gold demand, which includes over-the-counter (OTC) trades and other flows, fell 1% from a year earlier to 1,368.6 tonnes. Even the broad tally does not show a boom across all buyers.
What does the split mean if you own physical gold?
Gold helps a central bank spread risk because, unlike a bond, it is not another issuer’s promise to pay. The council sees this goal as the main force behind official buying. It adds that less volatile prices may have helped at the margin. But the quarterly figures cannot prove why each bank bought.
Your goals may differ. If you own bullion, you have no bond issuer to rely on. But you also face price drops, storage costs and no interest. You still need cash you can reach when you need it. A gold-backed ETF share does not put bullion in your hands.
The Q3 tally cannot set a floor under gold. More country reports may close part of the gap between the 120 tonnes reported and the larger estimate. Later bar-and-coin and ETF flows will show if this split lasts. The point is not to copy a reserve manager’s trade, but to know what purpose your own gold serves.
Stay On Top of Gold & Silver Prices
Get important market alerts sent straight to your inbox.
SOURCES
1. World Gold Council — Gold Demand Trends: Q3 2026
2. World Gold Council — Gold Demand Trends: Q3 2026 (Central Banks)
3. World Gold Council — Gold Demand Trends: Q3 2026 (Investment)
4. GoldSilver — Central Bank Gold Buying: Why 39 Tonnes Matters
5. GoldSilver — Gold ETFs Lost 45 Tonnes Last Quarter. Central Banks Bought 289. Here’s What That Split Means.
Disclaimer: This article is for informational purposes only and does not constitute investment advice. Past performance is not indicative of future results. Always consult a qualified financial advisor before making investment decisions.
You May Also Like:
- Gold, Silver Prices Today: Why Are They Rebounding?
- Gold and Silver’s October Selloff: What Changed?
- Silver Price Below $50: Why It’s Falling Faster Than Gold
- China Gold Imports via Hong Kong: Up Over 28%, Demand Mixed
- World Bank Precious Metals Outlook: 2027 Forecast
- Silver Tests Its 2026 Low Again
- Gold Price Today: Does It Rise or Fall in an AI Stock Selloff?
- Durable Goods Beat: What It Means for Gold Price Today
- Gold Steadies Near $4,000 as Fed Week Begins
- Russia Is Selling Gold: Why That’s Not Bearish