In early February 2025, most investors weren’t thinking about silver. It had spent months trading in the $30s, largely forgotten by the broader market.
Stocks were still the story. The S&P 500 had been on a long run. Gold was getting some attention, but silver? Silver was quietly sitting in gold’s shadow — just as it often does before it isn’t.
On February 6, 2025, Mike Maloney and Alan Hibbard sat down to record a video for the GoldSilver YouTube channel. The title asked a pointed question: Is Silver Set to Outperform Gold by 9X?
At the time, that probably sounded aggressive to a lot of people.
Looking back now, it turned out to be one of the more important calls they’ve made.
The Number That Started the Conversation
The gold-silver ratio — a measure of how many ounces of silver it takes to buy one ounce of gold — had climbed to around 90-to-1. That’s a historically extreme reading. For context, the long-term average for the ratio sits closer to 50-to-60-to-1. Levels above 80 have historically been rare, and they’ve often preceded powerful silver rallies.
Mike opened the video with some big news, “We are up at a gold-silver ratio of about 90 to 1, and I’m expecting it to go to something like 10 to 1.”
Then he did the math out loud: “If gold rises 200% or 300%, you can take that times nine — that would be the performance of silver.”
That’s the core logic of the gold-silver ratio as a trading signal. When silver becomes historically undervalued relative to gold, and a precious metals bull market takes hold, silver tends not just to catch up — it tends to overshoot.
What Was Actually Happening in the Market
The gold-silver ratio was the starting point for their discussion. The more interesting question was what it meant for prices next.
Alan walked through what he and Mike called a capital rotation: a historical pattern in which money moves out of traditional financial assets — stocks, bonds — and into hard assets like gold, silver, and commodities. They pointed to a set of market indicators they called a CR (capital rotation) signal, with multiple economic inputs flipping from green to red.
Alan explained the historical pattern, “During a capital rotation event, gold rises hundreds of percent… and commodities massively outperform.”
They also highlighted something happening in real time: central banks had been buying gold at an extraordinary pace. Data from the World Gold Council showed that central banks purchased more than 1,000 tons of gold in 2024 — the third consecutive year above that threshold. In the final quarter alone, after Trump’s election victory, central bank buying accelerated 54% year-over-year.
But that wasn’t all. Alan flagged something highly unusually in the silver markets during the recording:
“The borrowing fee on SLV ETF has just gone vertical, up 10x since this morning, 10x!”
That kind of move in a borrowing fee typically signals one thing: someone, somewhere, needs physical silver badly enough to pay a serious premium for access to it. It was an early warning sign of supply tightness — the kind of signal that tends to precede larger price moves.
What Actually Happened Next
Here’s what the numbers look like if you bought silver on February 6, 2025 — the day that video went live.
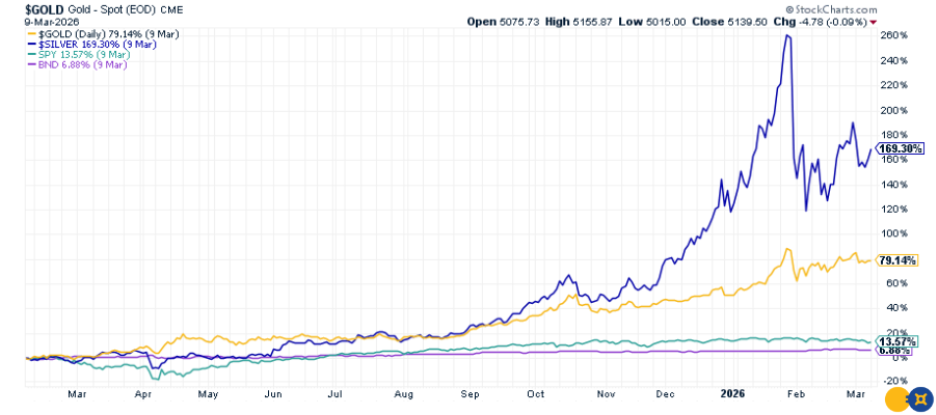
- Silver: +169%
- Gold: +79%
- SPY (S&P 500 ETF): ~+13–14%
- BND (Vanguard Total Bond Market ETF): ~+7%
Silver didn’t just outperform gold. It outperformed the S&P 500 by more than 12-to-1. It outperformed bonds by more than 24-to-1.
The chart below helps explain why.
The Gold-Silver Ratio
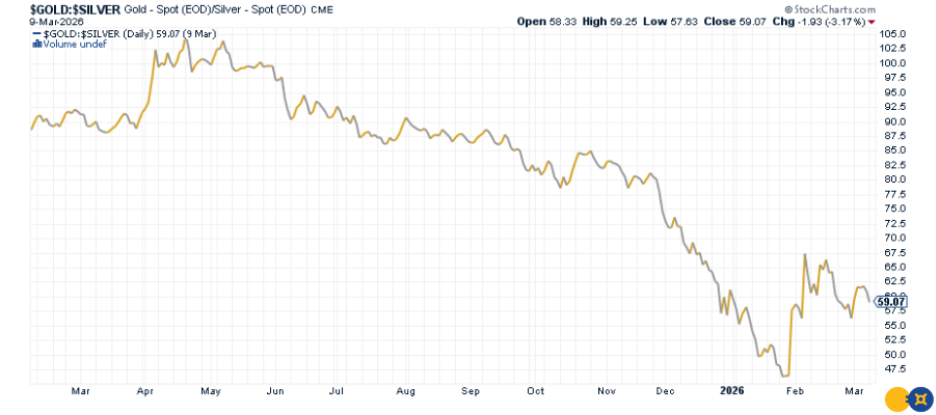
When Mike and Alan recorded that video, the ratio sat near 90-to-1. It would briefly get worse before it got better — touching 100-to-1 in April 2025, one of the most extreme readings in modern history. Then it reversed.
By early 2026, the ratio had compressed all the way down to roughly 47-to-1 — nearly cut in half from its peak — before settling around 59-to-1 as of early March. That compression is the silver outperformance story, visualized. As silver surged relative to gold, the gap between the two metals closed sharply, and investors positioned before that move captured most of the gain.
Mike’s ultimate target of 10-to-1 hasn’t played out yet. But the directional call was exactly right — and the distance already traveled was enough to generate returns most investors won’t see in a decade of holding traditional assets.
That’s how the gold-silver ratio works as a signal. It doesn’t hand you a precise price target or a guaranteed timeline. What it does is identify moments when silver is historically cheap relative to gold — and give investors a historically grounded reason to pay attention.
Why Silver Moves the Way It Does
One of the most useful things Mike and Alan explain in the video is why silver behaves this way — because it isn’t random.
Gold typically leads precious metals bull markets. It’s the primary monetary asset, and institutional demand tends to find gold first. As the bull market matures and becomes more broadly recognized, capital flows into silver. And because silver’s market is much smaller than gold’s, that capital can move the price much more aggressively.
Mike described it this way in the video: gold outperforms stocks, and silver outperforms gold. In a full precious metals cycle, those two dynamics compound into something that can look almost implausible from the outside — until it happens.
This pattern has shown up before. It played out during the precious metals bull market of the 1970s. It showed up again during the commodity supercycle of the 2000s. And in 2025, with the gold-silver ratio at a historically stretched reading and institutional capital beginning to move, the conditions were in place for it to happen again.
Why This Matters Beyond the Last 12 Months
It would be easy to look at a 169% return and think: I missed it.
But Mike and Alan weren’t just making a one-year call. Their broader thesis — and one that Mike has built GoldSilver’s educational content around for decades — is that we’re in an early-to-mid stage precious metals cycle, not the final one.
The fundamental backdrop they pointed to in the video hasn’t changed. Central banks are still accumulating. The currency supply has expanded by historically extraordinary amounts. And the gold-silver ratio, while it has compressed significantly from its early 2025 peak, is still well above its long-term average.
Mike put the longer-term framing simply near the end of the video: “The best is yet to come.”
Markets will have the final word. But when signals line up like that, it’s worth paying attention.

Get Expert Insights from Alan Hibbard Learn from Alan Hibbard, a trusted voice in precious metals delivering clear, actionable analysis on gold, silver and the global economy.
The Gold-Silver Ratio as a Market Signal
The gold-silver ratio has been tracked for centuries as a way to compare the relative value of the two metals. In earlier monetary systems the ratio was sometimes fixed by governments under bimetallic standards. Today, however, it floats freely in global markets.
In the modern era, the ratio has averaged closer to 50–60 to 1 over long periods. When the ratio rises far above that range, it can signal that silver is historically cheap relative to gold.
That doesn’t mean the ratio must immediately return to its long-term average. However, extreme levels have often been followed by periods when silver outperforms gold.
In early 2025, when the ratio approached 90-to-1, it represented one of those historically stretched conditions.
As the past year has shown, those moments can create significant opportunities.
The Takeaway for Investors
The gold-silver ratio isn’t a magic indicator. No single number is. Markets are messy, and precious metals can be volatile — they don’t move in straight lines, and they can test your patience in ways stocks often don’t.
But extreme readings in the gold-silver ratio have a long history of preceding powerful silver moves. And when you pair that signal with other indicators — central bank demand, physical market tightness, institutional capital rotation — the picture can become more compelling.
In early February 2025, multiple signals were pointing in the same direction. Mike and Alan saw them, made the case publicly, and the market validated their read in dramatic fashion.
If there’s one practical lesson from all of this, it’s a simple one: when the gold-silver ratio gets to historically extreme levels, it’s worth paying attention. And if you want to know when that’s happening in real time — along with the broader context that helps you understand why — the GoldSilver YouTube channel is one of the better places to look.
They called it once. Loudly. In public. And they were right.
Watch the original February 2025 discussion between Mike Maloney and Alan Hibbard below.
Investing in Physical Metals Made Easy

People Also Ask
Why did silver outperform gold after the gold-silver ratio hit 90?
When the gold-silver ratio climbs to extreme levels, it often signals that silver may be undervalued relative to gold. Historically, periods like this have sometimes been followed by strong silver rallies as the ratio moves back toward more typical ranges. The 2025 move highlighted how quickly silver can outperform once momentum shifts.
What is the gold-silver ratio and why do investors watch it?
The gold-silver ratio measures how many ounces of silver it takes to buy one ounce of gold. Investors track it because extreme readings can signal relative value between the two metals.
Is silver usually more volatile than gold?
Yes, silver tends to move more dramatically than gold during precious metals cycles. Because the silver market is smaller, increases in investment demand can push prices up much faster. This is why silver often outperforms gold during strong bull markets—but it can also experience larger swings.
Why do silver prices sometimes lag gold before rising?
Gold usually leads precious metals bull markets because it acts as the primary monetary asset and attracts institutional demand first. As investor interest grows, capital often flows into silver, which can produce faster price moves later in the cycle. This pattern has repeated in several historical precious metals rallies.
Can the gold-silver ratio predict when silver will rally?
The ratio cannot predict timing perfectly, but extreme levels have often preceded periods of strong silver performance. When the ratio rises far above its long-term range, it can signal that silver is historically cheap compared with gold. Many investors use the ratio as one indicator among several when evaluating precious metals markets.