Gold & Silver Supply and Demand: What Really Drives Prices Over Time
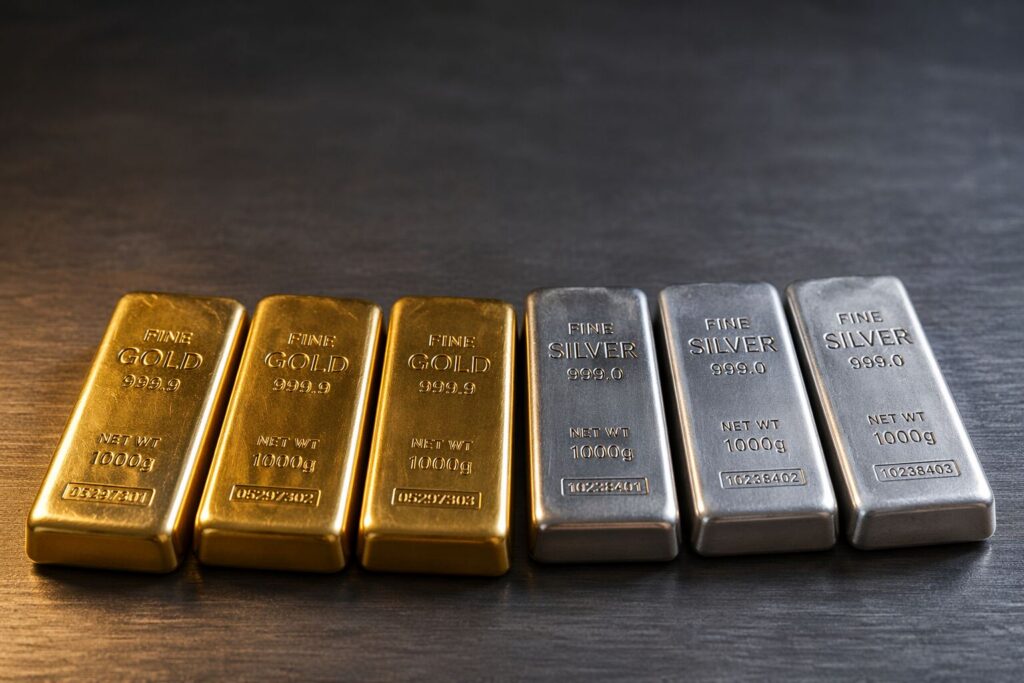
Gold and silver prices don’t move by chance. Discover the key supply and demand forces — from central bank activity and real interest rates to silver’s growing industrial role in solar and EVs — that drive precious metals prices over time and what they mean for your portfolio.
Silver Holds Near $80 as Iran Ceasefire Revives Rate-Cut Bets

Silver surged more than 5% Tuesday and is holding near $80 — the highest level since March. The move isn’t simple. When the US and Israel launched their air campaign against Iran, gold fell 10% instead of rising. The reason was oil, the Strait of Hormuz, and an inflation shock that killed rate-cut expectations. The Iran ceasefire is now reversing all three dynamics at once — and silver is responding through both its monetary and industrial demand channels. Here’s the mechanism, the data, and the one date every precious metals investor should have on their radar.
The Fed Goes Silent in 3 Days – What Does That Mean For Gold?
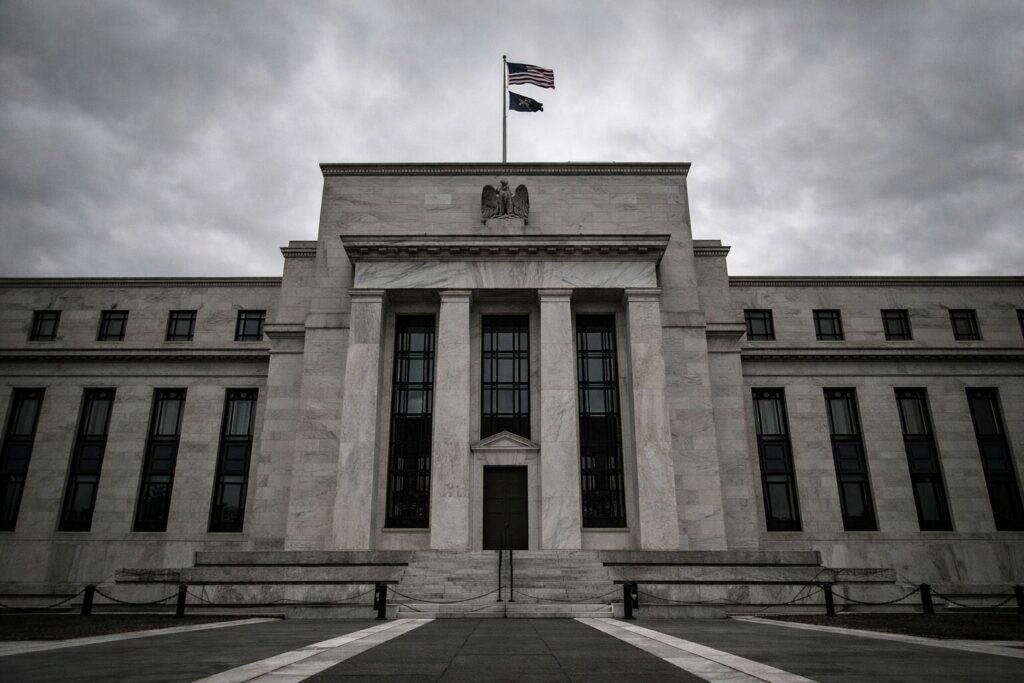
The Fed goes silent April 18. For 12 days, no official can speak on rates — just as the Iran ceasefire teeters and stagflation data lands. Here’s what the FOMC blackout means for gold.
Gold Is Down 10% From Its War-Peak — and Still Up 46% in a Year
Gold is down 10% from its war-peak — but up 46% in a year. The March PPI just hit 4.0%, the hottest since the conflict began. The headlines are telling the wrong story.
Gold Dip Buying Explained: Is This A Smart Move Now?
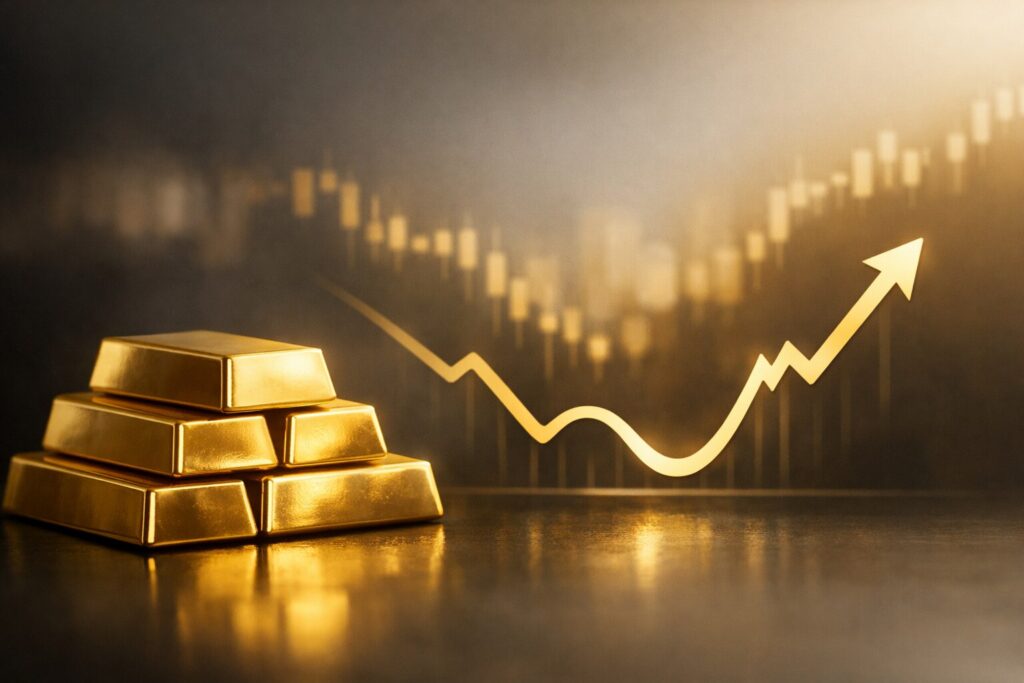
Gold set an all-time high of $5,595 per ounce in January 2026 — then pulled back roughly 15% by mid-April. For investors watching from the sidelines, gold dip buying is firmly back in the conversation. But a lower price alone isn’t a strategy. This guide covers what’s actually driving the correction, what central banks and major analysts are forecasting, and how to enter with discipline rather than impulse.
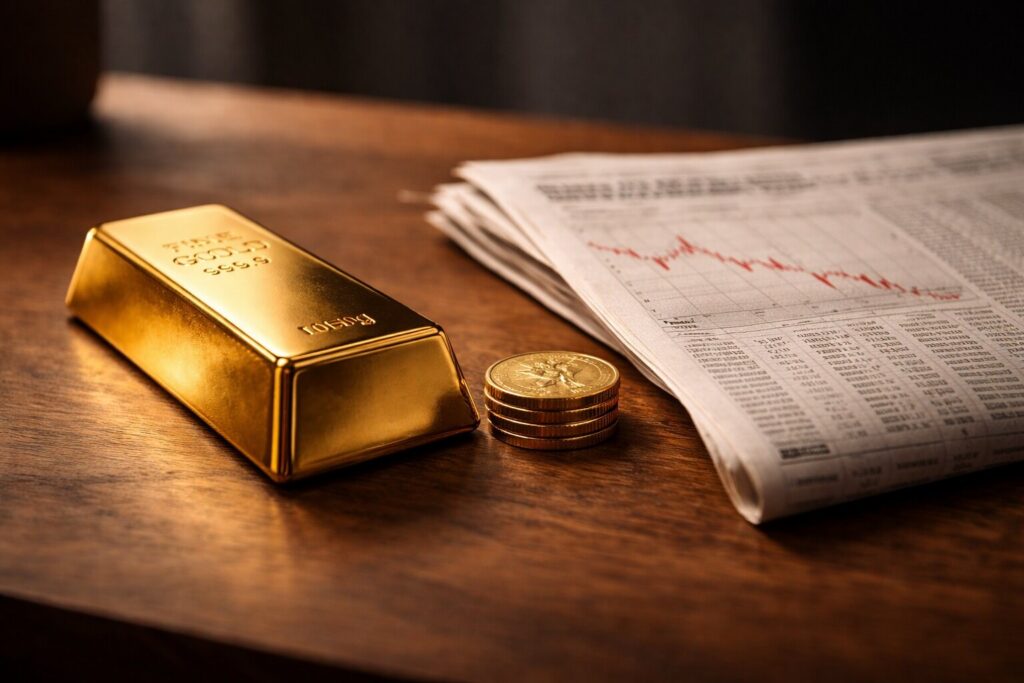
$88 Billion a Month: Why U.S. Debt Is Driving Gold Prices
Does US debt drive gold prices? The CBO confirmed the U.S. paid $529 billion in interest in just the first half of fiscal 2026 — $88 billion a month. Gold is at record highs and climbing. Here’s the fiscal mechanism every saver needs to understand before the next $88 billion bill arrives.
CPI Hits 3.3%, GDP Stalls — Is Stagflation 2026 Here?
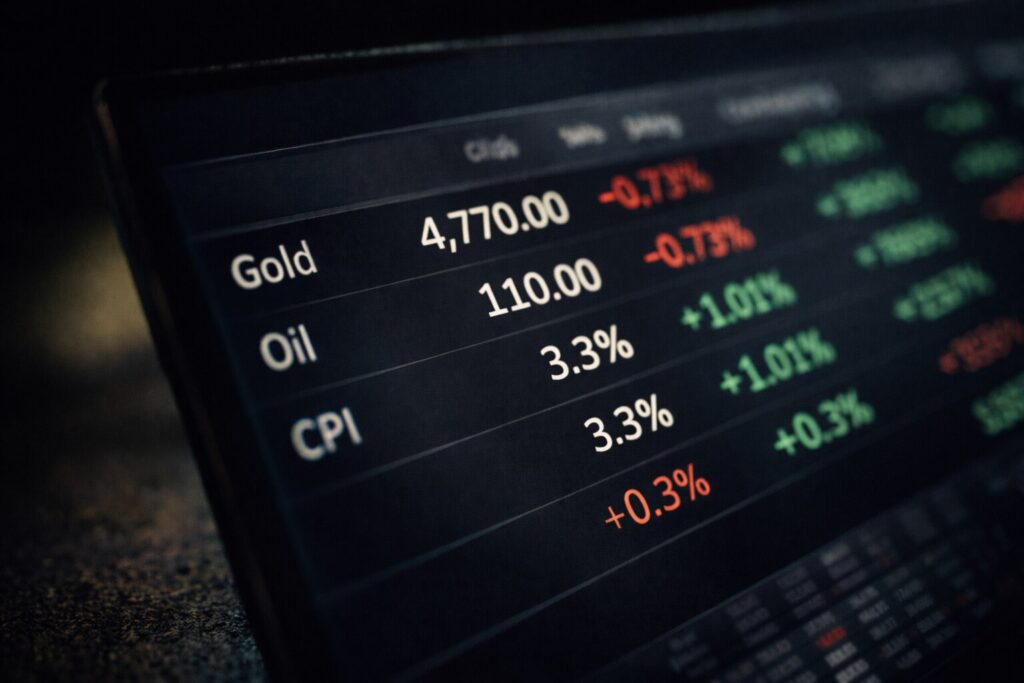
March CPI surged to 3.3% — the highest since May 2024 — while Q4 GDP sits at just 0.5%. The stagflation 2026 thesis is now backed by hard data. Gold eyes a third weekly gain as the Iran ceasefire cracks and Islamabad talks loom. Five stories you need this morning.
Iran Ceasefire Sends Gold to $4,800 — Now What?

Gold is pushing toward $4,800 and silver jumped nearly 6% after a U.S.-Iran ceasefire reopened the Strait of Hormuz. But this rally isn’t just about the war pausing — central banks, dollar weakness, and monetary debasement remain the structural bid under precious metals.
Gold Price Forecasts for 2026, Revisited After Q1
Gold prices are shaped by powerful forces — real interest rates, U.S. dollar strength, central bank demand, and geopolitical risk. This guide breaks down the key drivers behind gold future prediction, reviews a decade of historical performance, and outlines what investors should watch heading into 2026.
Why Western Investors Are Late to Gold’s Next Bull Market

Gold reached record highs even as Western ETF investors sat out. Here’s why: central banks and emerging markets have fundamentally changed who drives gold demand—and what that shift means for portfolio strategy going forward.
