 Silver Rises Over 120% YTD




The Dot Plot Has 18 Dots. The Chair Withheld His.

The Fed’s June dot plot had 18 projections, not 19. Chair Warsh withheld his. The split is 9-to-9 — not the hawkish mandate markets have priced into gold.
Hawkish Fed, Gold Below $4,000, Silver Below $60 — and a Market That Disagrees.
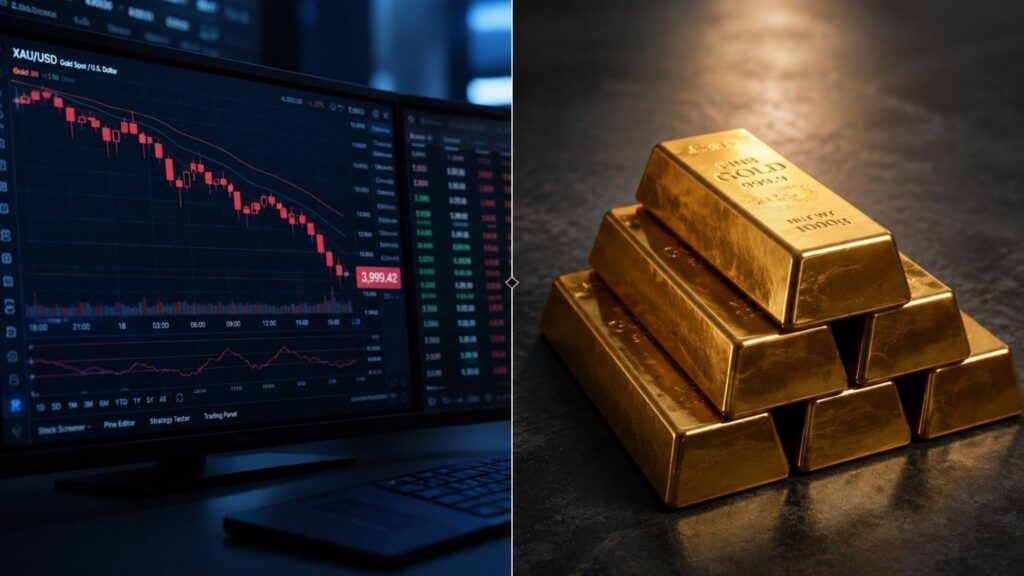
Gold broke below $4,000 for the first time since November 2025. China hit a two-year import high. Major banks held their targets. Five signals that tell the real story.
Rate Hike Odds Just Hit 85%. Gold Is Up. Here’s Why.
Rate hike odds just hit 85%. Gold is up anyway. Most headlines won’t explain why — because the answer requires flipping the standard model upside down. The number that actually drives gold isn’t the fed funds rate. It’s the real yield. Here’s the mechanism.
Gold Won’t Break. The Fed Just Told You Why.
The Fed just released its most hawkish minutes in over a decade. December rate hike odds hit 40%. The dollar surged. Gold barely moved. That non-reaction is not confusion — it’s the market pricing a structural ceiling on how far this Fed can actually tighten. Here’s the mechanism behind it.
Kevin Warsh Wants to Fix the Fed. The Math Says He Can’t.
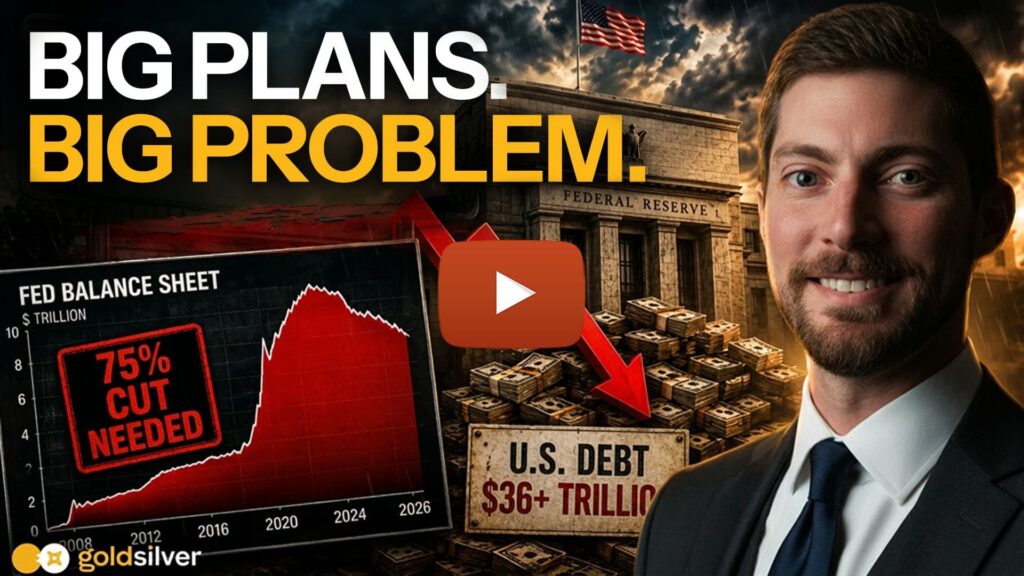
Kevin Warsh arrived at the Fed with a bold agenda — shrink the balance sheet, normalize policy, restore credibility. But with $6.7 trillion in assets, global bond yields at multi-decade highs, and markets pricing in rate hikes instead of cuts, the math is working against him. Alan breaks down why the plan may be dead on arrival and what it means for gold.
The Real Reason Gold Falls When Inflation Surges
April CPI hit 3.8% — and gold dropped. If that feels backwards, it should. Here’s the chain: hot inflation forced traders to reprice the Fed toward rate hikes, which lifted the dollar, which pressured gold. The short-term mechanics and the long-term case are two different things — and today is a perfect illustration of why.
Silver Holds Near $80 as Iran Ceasefire Revives Rate-Cut Bets

Silver surged more than 5% Tuesday and is holding near $80 — the highest level since March. The move isn’t simple. When the US and Israel launched their air campaign against Iran, gold fell 10% instead of rising. The reason was oil, the Strait of Hormuz, and an inflation shock that killed rate-cut expectations. The Iran ceasefire is now reversing all three dynamics at once — and silver is responding through both its monetary and industrial demand channels. Here’s the mechanism, the data, and the one date every precious metals investor should have on their radar.
The Fed Goes Silent in 3 Days – What Does That Mean For Gold?
The Fed goes silent April 18. For 12 days, no official can speak on rates — just as the Iran ceasefire teeters and stagflation data lands. Here’s what the FOMC blackout means for gold.
Hot PCE, Stalling Growth, and an Oil Crisis That Isn’t Over
PCE inflation came in at 2.8% year-over-year in February — above the 2.6% forecast and unchanged from January. Combined with near-stalled Q4 GDP growth and an unresolved energy crisis, today’s data paints a complicated picture for the Fed and a familiar one for gold.
Gold Prices and Real Interest Rates: What Every Investor Must Know
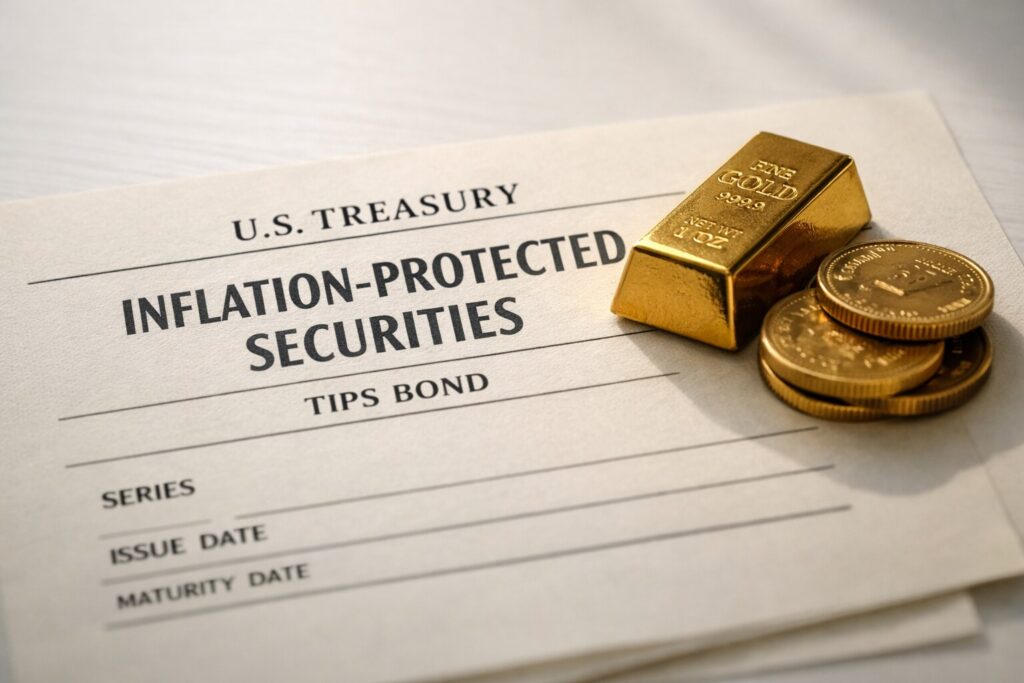
Real interest rates — not headlines — drive gold prices. When real yields fall, gold rises. When they rise, gold faces headwinds. Learn how to read the 10-year TIPS yield, breakeven inflation rate, and Fed rate expectations to anticipate gold’s next move and align your precious metals allocation accordingly.


