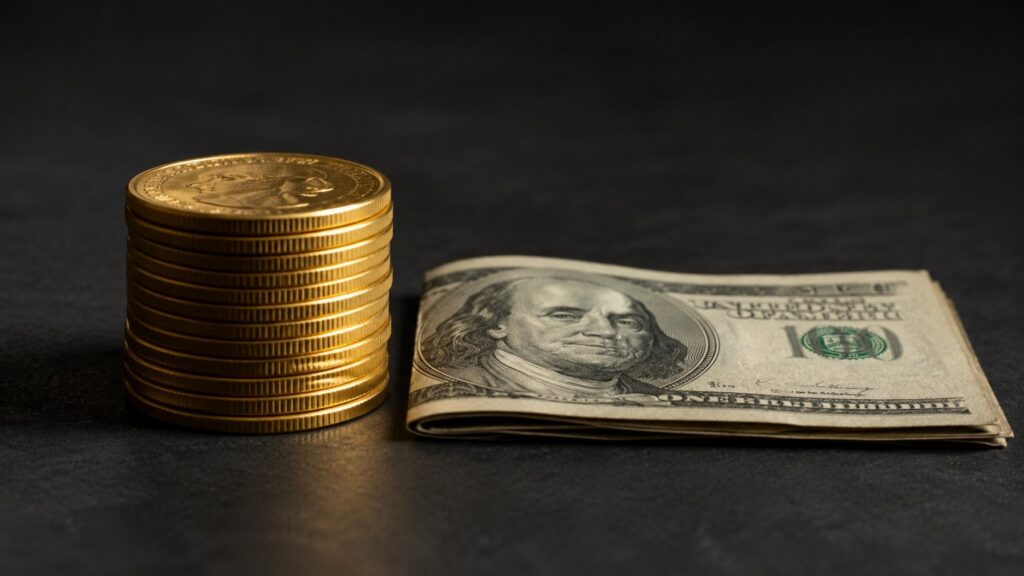
Why the 10-5-3 Rule Fails Gold and Silver Investors
Excerpt:
The 10-5-3 rule helps investors set return expectations for stocks, bonds, and cash. But gold and silver aren’t paper assets — and measuring them with a framework built for yield and earnings leads to the wrong conclusions every time. Here’s what precious metals investors use instead.
Gold Price Outlook July 2026: The Price Fell. Case Intact.

Gold trades 28% below its January record as Fed rate-hike expectations weigh on real yields. The structural case — central bank buying, fiscal expansion, reserve diversification — has not reversed. Here is what the macro picture means for gold holders in July 2026.
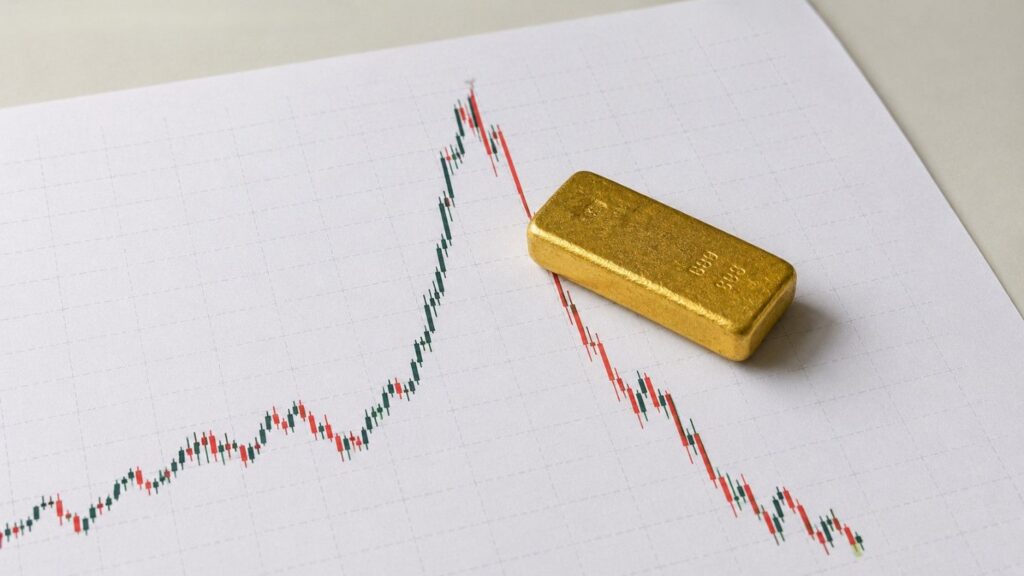
Buying the Top: A Survival Guide for Gold and Silver Investors
Gold hit $5,589 in January 2026. It trades near $4,100 today. If you bought near the top, your paper loss is real — but it is not final. This guide walks through your three strategic paths: hold patiently, dollar-cost average at lower prices, or harvest the tax loss and immediately repurchase. The structural case for gold has not changed. The price has.
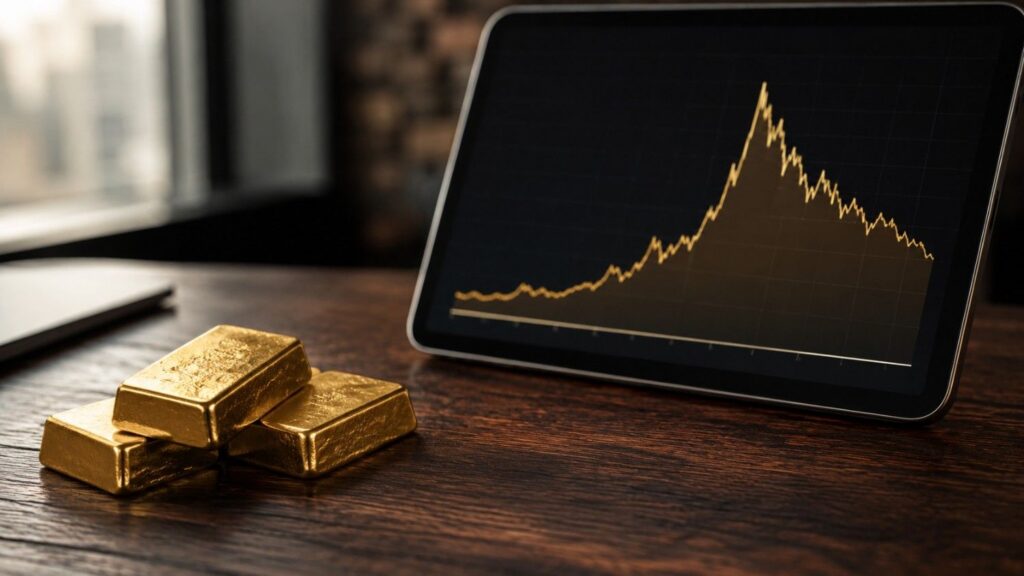
How Do Gold Price Cycles Work? A Framework Across Four Time Horizons

Gold price cycles operate across four distinct time horizons — from 40-year structural waves to annual seasonal patterns. Here is the complete framework.
What Is Profit Booking in Gold and Silver? The Mechanism Explained
Profit booking in gold and silver means selling a position to lock in gains after a price rise — not a sign the bull market is over. This guide explains the mechanism behind the price dips, why silver falls harder than gold, and what it means for long-term holders of physical metal.
Gold Technical Analysis: A Complete Investor’s Guide
Gold technical analysis explains how moving averages, RSI, MACD, and Fibonacci retracement levels work — and how long-term physical holders can use them to size positions and time entries more intelligently.
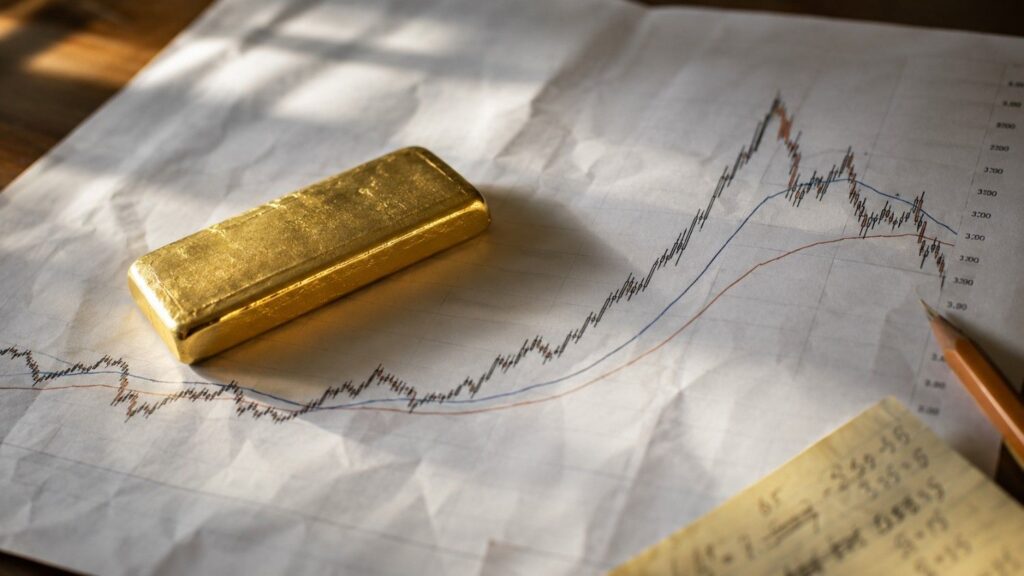
Gold Down 26%. Barclays’ $4,791 Target Never Moved.

Barclays held its $4,791 gold target through a 26% correction. Here’s the fair-value framework behind that call — and what it means for gold investors today.
Gold Price History: From $35 to $4,500 in 100 Years

Gold went from $35 in 1971 to around $4,500 today — a 12,000% gain since the gold standard ended. Meanwhile, the dollar lost 96.9% of its purchasing power over the same period. These are not two separate stories. This is the complete gold price history: decade by decade, the real cause behind every major move, and what a century of data tells investors right now.
India’s ‘Patriotic’ Gold Buying Freeze: What It Means for Prices

India’s PM just asked 1.4 billion people to stop buying gold for a year. The world’s second-largest gold market going quiet has real implications for global bullion prices — and a bigger message for Western investors.
How to Time Your Gold & Silver Buys Using Technical Analysis

Gold has pulled back roughly 16% from its January 2026 all-time high of $5,589. For long-term stackers, understanding support levels, moving averages, RSI, and the gold-silver ratio can mean meaningfully more ounces per dollar over time.
