India’s ‘Patriotic’ Gold Buying Freeze: What It Means for Prices

India’s PM just asked 1.4 billion people to stop buying gold for a year. The world’s second-largest gold market going quiet has real implications for global bullion prices — and a bigger message for Western investors.
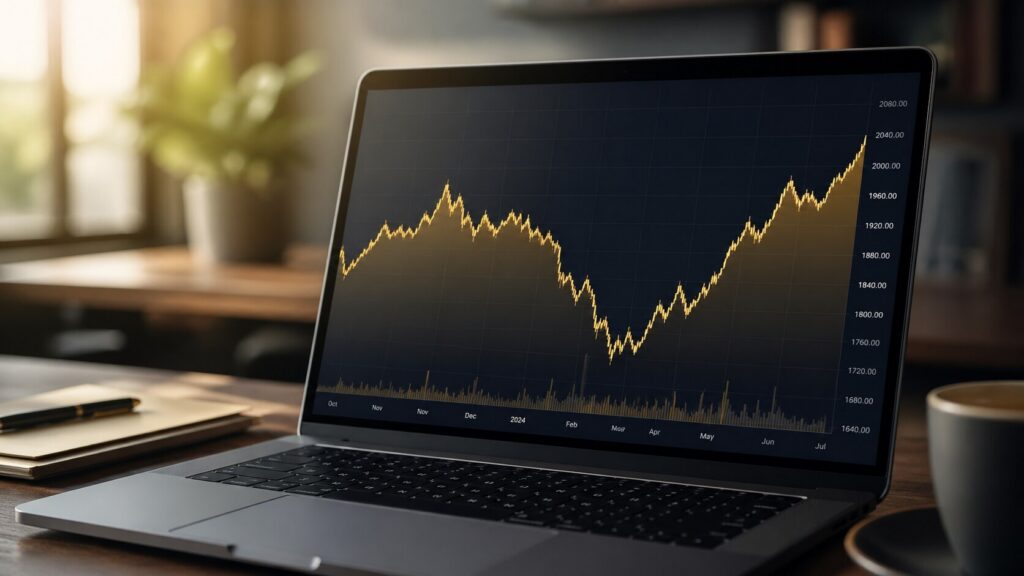
How to Time Your Gold & Silver Buys Using Technical Analysis
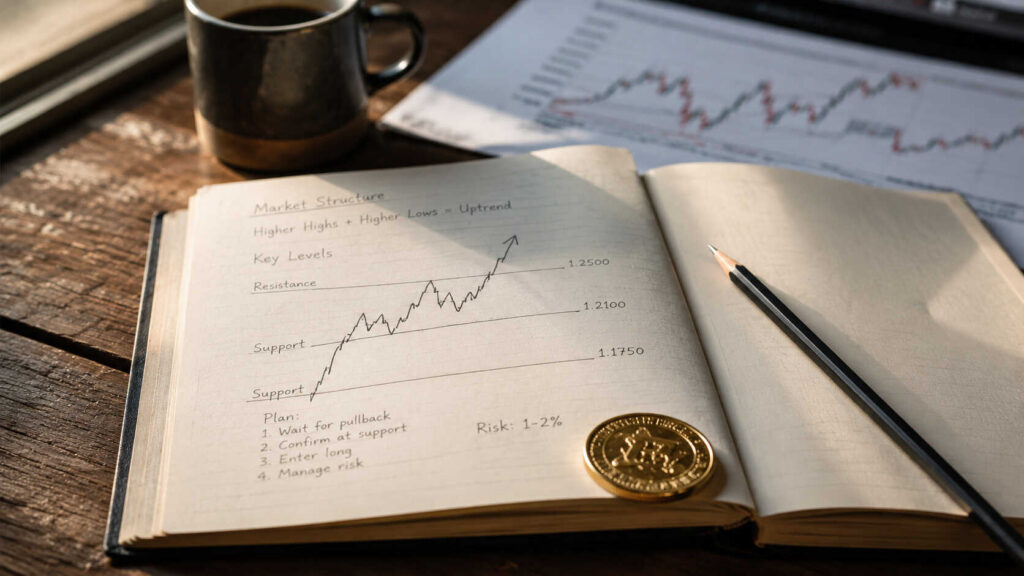
Gold has pulled back roughly 16% from its January 2026 all-time high of $5,589. For long-term stackers, understanding support levels, moving averages, RSI, and the gold-silver ratio can mean meaningfully more ounces per dollar over time.
Gold vs Stocks vs Real Estate: What the Data Shows

Stocks are at historically extreme valuations. The 40-year bond bull market is over. Real estate carries new structural risks. When you compare gold vs stocks vs real estate through a data lens, one asset class stands apart — and the macro conditions driving it are only getting stronger.
When Markets Crash, Gold Does This Every Time

Fear moves faster than greed — and gold has proven it across every major crisis of the last 100 years. Here’s what the historical record actually shows, from the Great Depression to COVID.
$5,500 Gold by Q1 2027? The Central Bank Risk Driving It
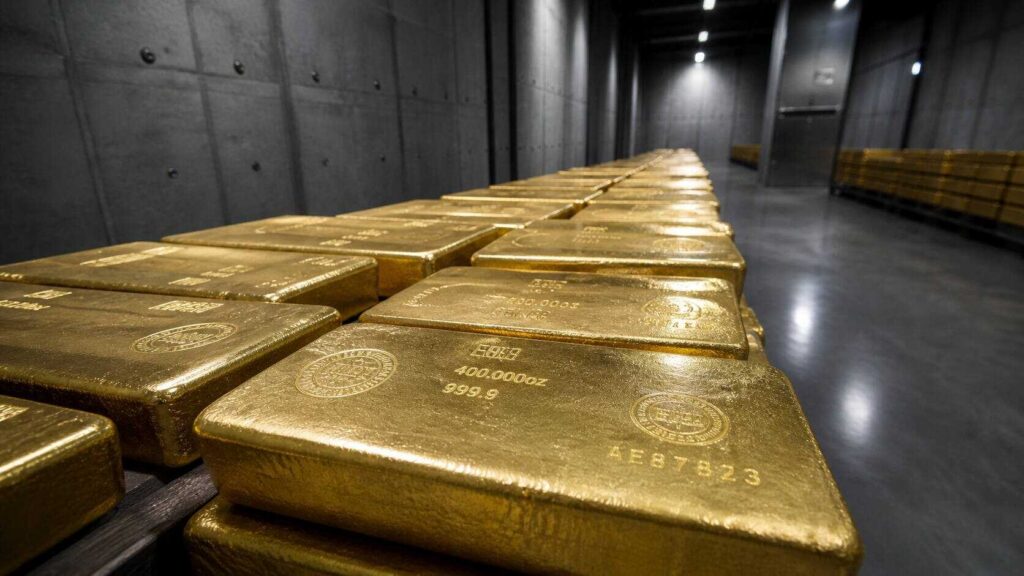
Gold has pulled back 18% from its January 2026 all-time high of $5,589.38. But structural forces — central bank buying, policy uncertainty, and dollar weakness — are pointing toward $5,500 by Q1 2027.
Gold vs. Fiat Currency: A 50-Year Reckoning

When governments abandoned gold-backed money in the 1970s, they didn’t just change monetary policy — they rewired human behavior. Understanding that shift is key to understanding where precious metals are headed.
What the Gold Price Per Ounce Really Tells You
Most investors glance at the gold price per ounce and move on. But this single number reveals more about the health of the monetary system than almost any other metric — here’s how to read it.
The Gold Inflation Paradox Most Investors Miss
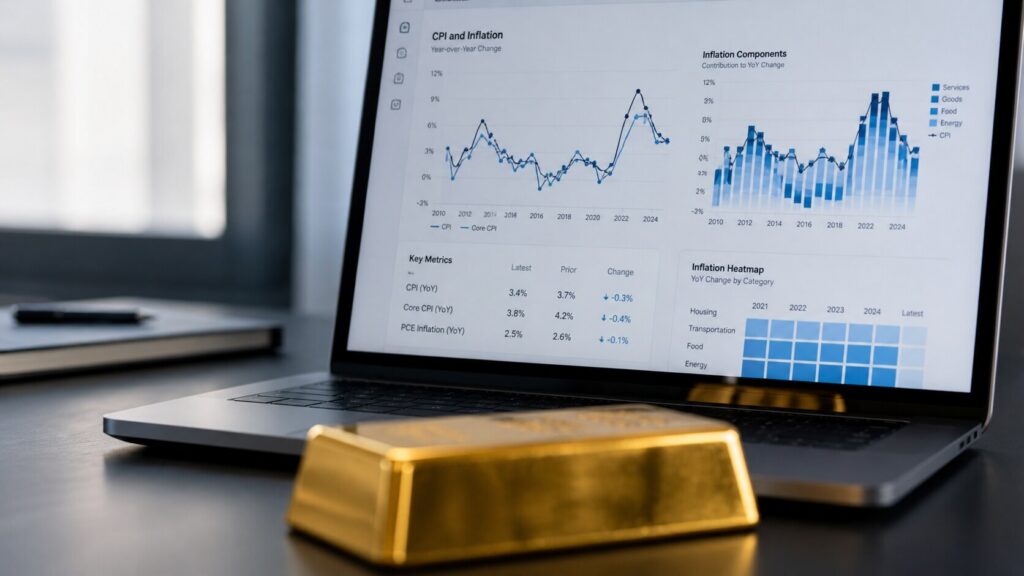
Gold fell around 15% from its all-time high while inflation hit a nearly 3-year peak. The inflation-hedge narrative isn’t wrong — it’s incomplete. Here’s what the data really shows about gold and rising prices.
Gold or Silver Price Dip: Temporary Correction or Trend Reversal?
When gold or silver prices fall, the real question isn’t how far — it’s why. Learn how to read a price dip, spot the difference between a healthy correction and a genuine trend reversal, and respond with a strategy instead of emotion.
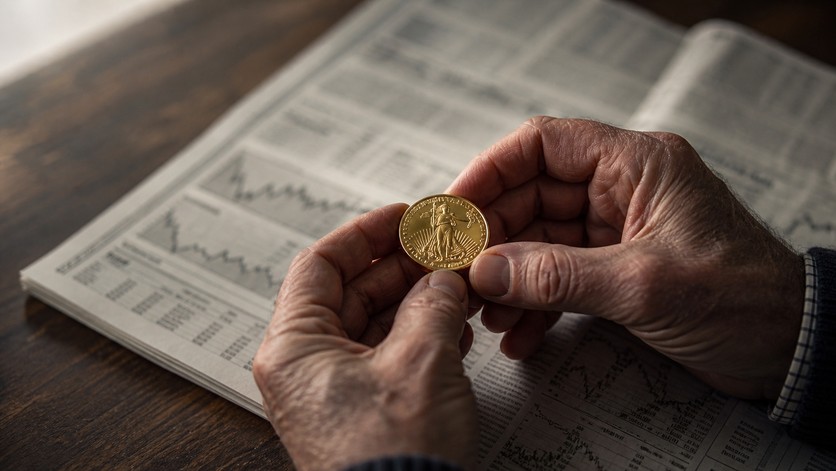
What History Shows About Buying Gold After a Pullback

Gold has pulled back 16% from its January 2026 all-time high. History shows corrections inside an active bull market reward patient buyers — and the structural case for gold hasn’t changed.
