 Silver Rises Over 120% YTD




Manufacturing Hit a Four-Year High Today. Gold Didn’t Move. Here’s Why That’s the Story.
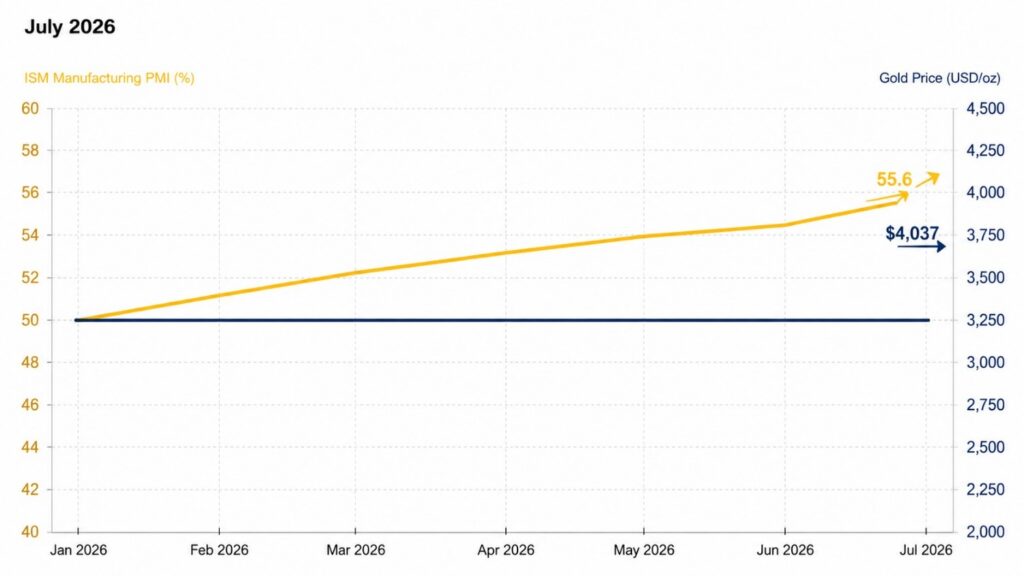
The ISM Manufacturing PMI just hit 55.6% — its strongest reading since May 2022. Gold barely moved. That non-reaction isn’t a failure to respond. It’s gold caught between two opposing forces that are almost perfectly canceling each other out, and this week’s data decides which one breaks first.
Central Banks Bought 289 Tonnes of Gold Last Quarter. Prices Were Falling the Whole Time.
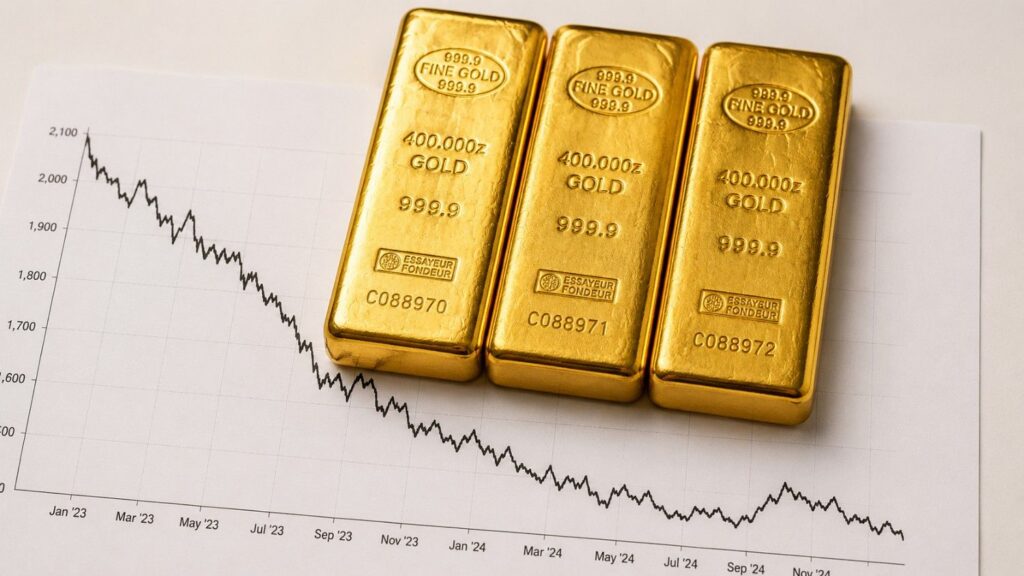
Central banks bought a record 289 tonnes of gold in Q2 2026 — while prices posted their steepest quarterly decline in a decade. The World Gold Council just published the data. Here’s what the buying pattern reveals about where the world’s largest reserve managers think the monetary system is heading.
The Federal Reserve Has Eroded 97% of Your Dollar’s Value Since 1913. Here’s the Mechanism.
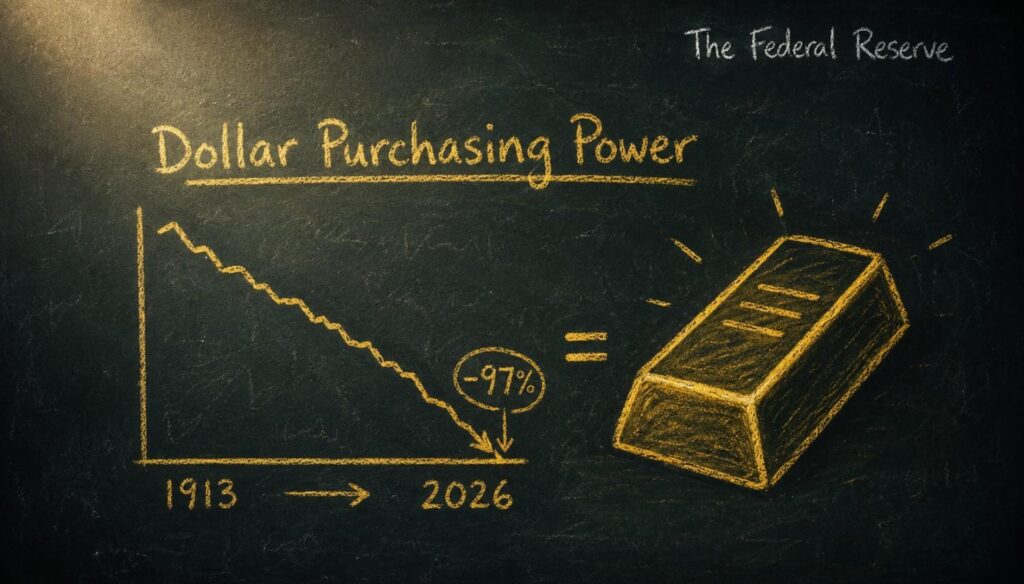
The Federal Reserve is the most powerful institution affecting what your money is worth — yet most people can’t fully explain how it works. This guide covers the Fed’s structure, dual mandate, and policy tools, and explains exactly why its 112-year track record of dollar debasement is the foundational case for owning gold.
Oil Spiked 8%. Gold Went Up Anyway. Here Is Why This Time Is Different.
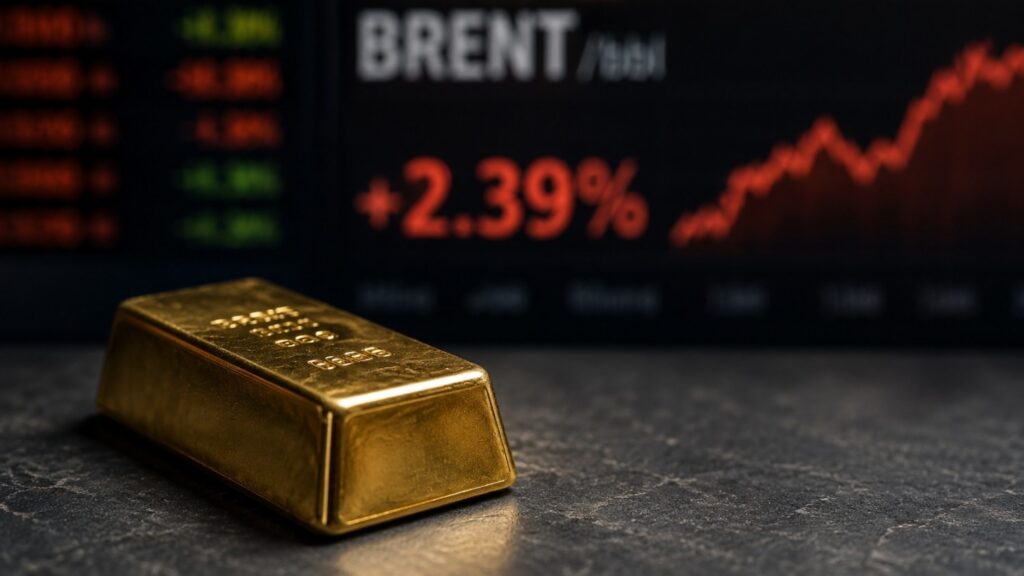
Brent crude surged 7.9% on July 29 after Iran fired missiles at US forces. Gold rose anyway. Here is why the standard suppression chain broke — and what the US Strategic Petroleum Reserve’s 43-year low means for every future oil shock.
Everyone Is Watching the Fed. Gold Is Watching Tomorrow at 8:30 a.m.
The Fed announces its rate decision today at 2:00 p.m. ET. But the number that will most directly determine gold’s next move arrives eight hours later — June PCE, the Federal Reserve’s preferred inflation gauge, releases Thursday at 8:30 a.m. ET. Here is the three-scenario framework that connects tomorrow’s print to your gold.
What Is a Gold-Backed Stablecoin? How One Private Buyer Changed the Gold Market
Since Q2 2025, one private company has been buying physical gold at a pace that has outrun almost every central bank on earth. Its name is Tether. Here is how a gold-backed stablecoin works, why its buying is price-insensitive by design, and what it means for gold demand — plus the full Adrian Day interview.
Newmont Earned $2.2 Billion Last Quarter. Gold Was Down 13%.
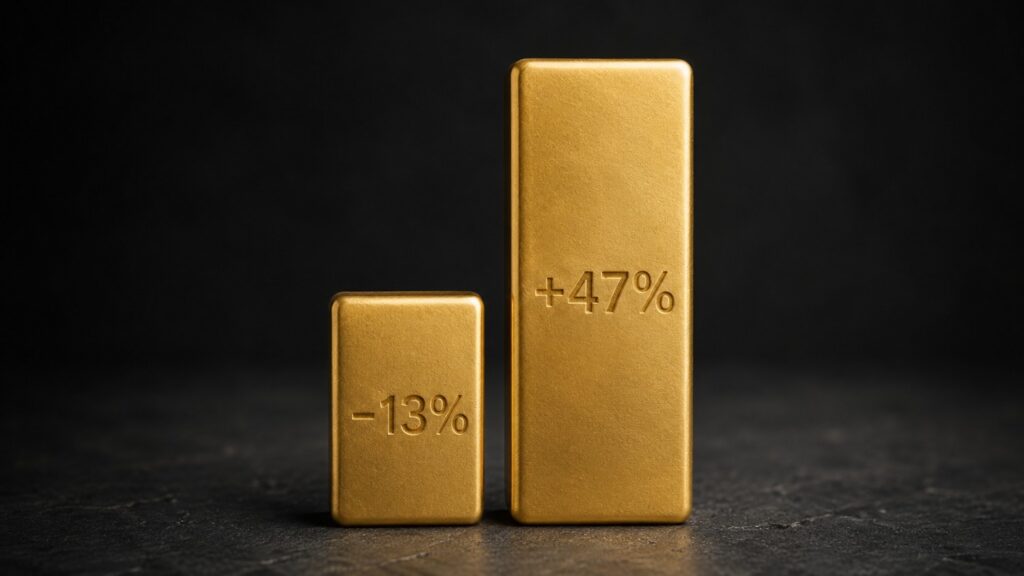
Newmont just reported $2.2 billion in quarterly earnings — during a quarter when gold fell 13%. Here’s the mechanism that explains how that’s possible, and what it means for precious metals investors.
Why Is Everything So Expensive? The Real Reason Explained

Everything you feel is wrong with the economy is real. Housing, wages, debt, and inflation aren’t separate problems — they share one cause. Here’s the mechanism, and why gold and silver have responded the way they have.
What Is the Gold Volatility Index (GVZ) — and What Does It Mean for You?
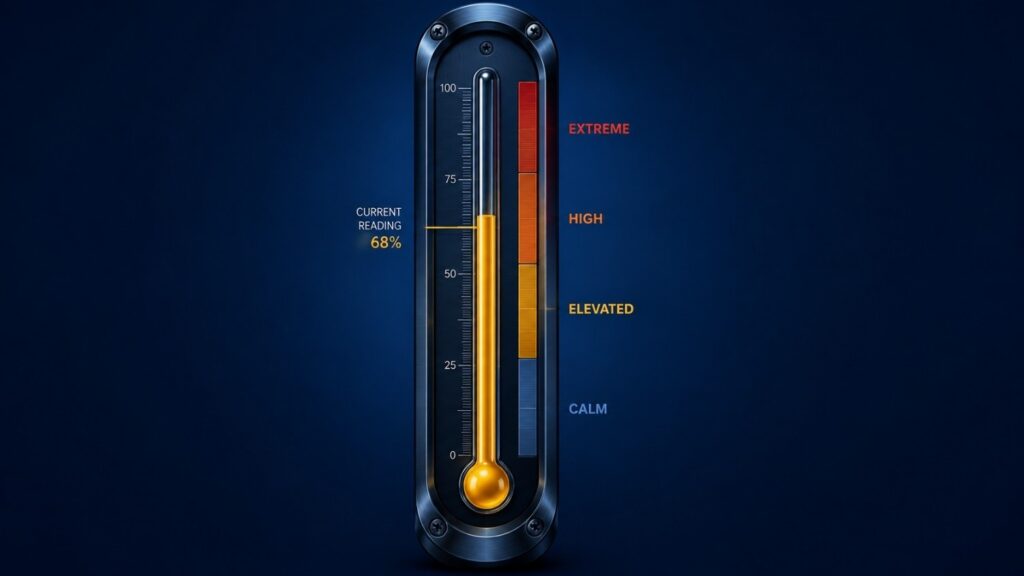
The GVZ (Cboe Gold ETF Volatility Index) measures what options traders expect gold prices to do over the next 30 days — using the same methodology as the VIX, applied to GLD options. Here’s what the historical regimes mean, why GVZ can spike during a gold bull market, and what it actually signals for long-term physical gold holders.
JPMorgan Cut Its Gold Forecast by 25%. Here’s What Long-Term Holders Need to Know.
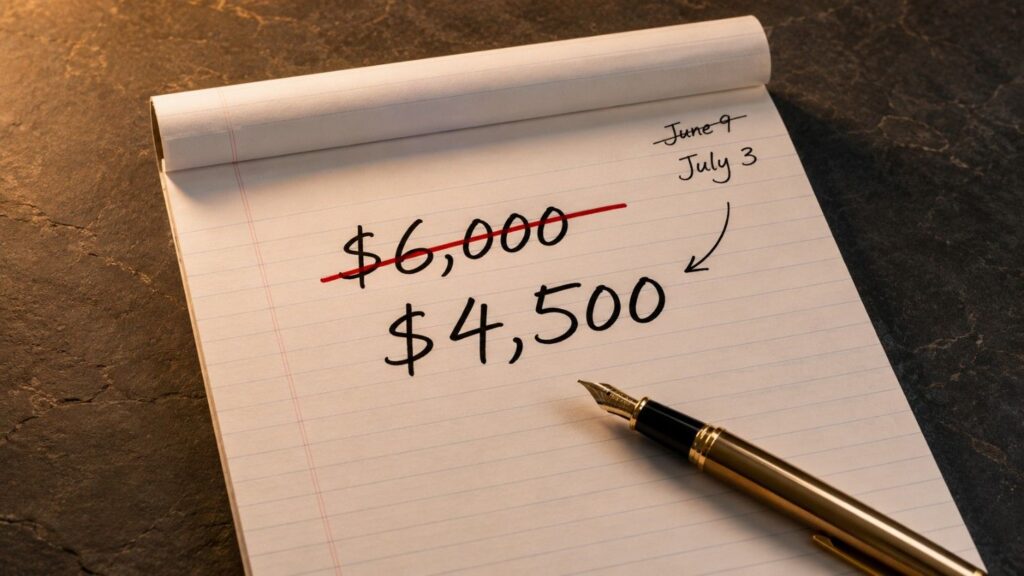
JPMorgan cut its Q4 2026 gold price forecast by 25% to $4,500 — down from $6,000 just 24 days earlier. Here’s the rate mechanism behind the cut, what the $3,500 downside scenario actually requires, and why JPMorgan’s long-term thesis on gold remains fully intact.


