When Gold’s Price “Goes Up,” You’re Reading It Backward

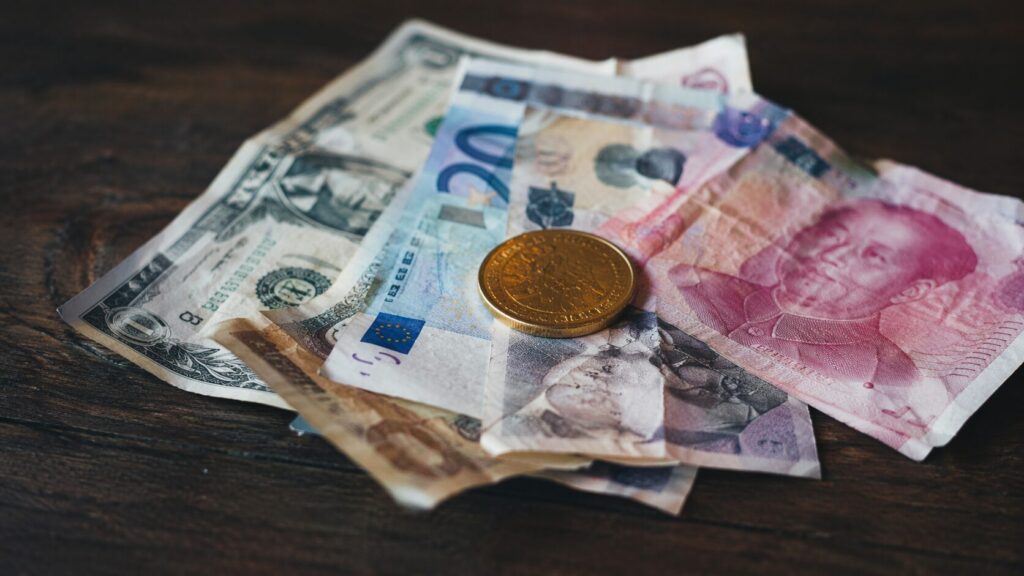
When gold’s price rises, most people think gold got more expensive. They’re reading it backward. Here’s why gold as a store of value changes how you think about money and savings.
Gold Price History: From $35 to $4,500 in 100 Years
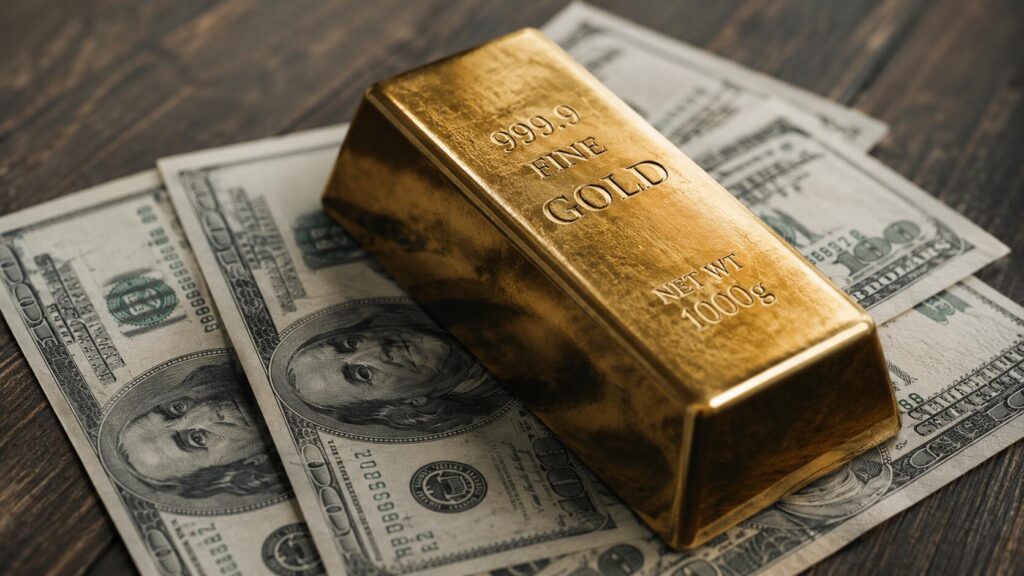
Gold went from $35 in 1971 to around $4,500 today — a 12,000% gain since the gold standard ended. Meanwhile, the dollar lost 96.9% of its purchasing power over the same period. These are not two separate stories. This is the complete gold price history: decade by decade, the real cause behind every major move, and what a century of data tells investors right now.
The Buyer List for Gold Just Got Longer. These Countries Have Never Bought Before.
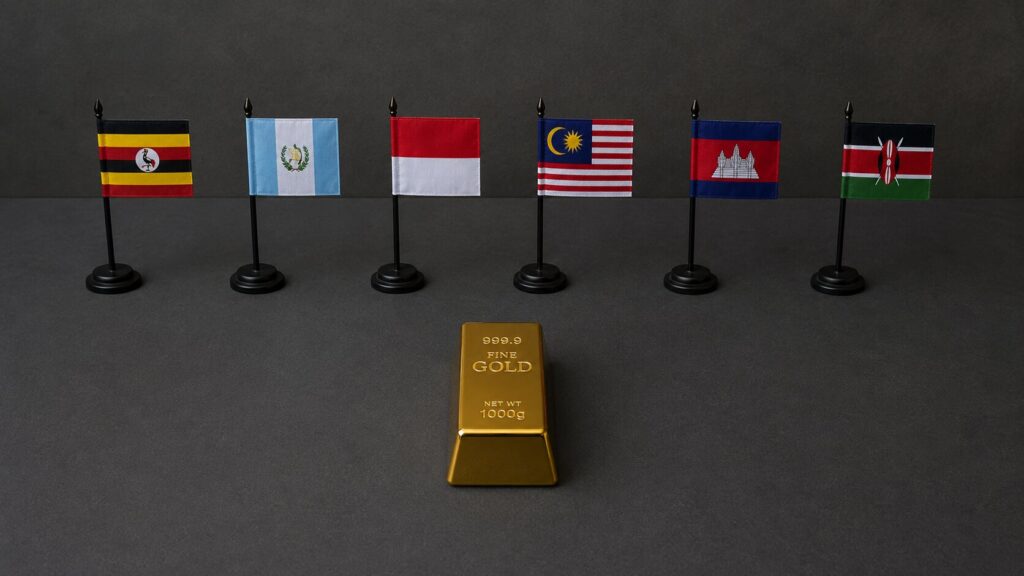
Central banks purchased a net 244 tonnes of gold in Q1 2026 — and for the first time, the buyer list includes countries like Guatemala, Indonesia, Malaysia, Cambodia, Uganda, and Kenya. Some are buying gold for the first time in their institutional history. Others are returning after decades of absence. Here is what the world’s most sophisticated reserve managers are telling you by voting with their balance sheets.
Gold vs Stocks vs Real Estate: What the Data Shows

Stocks are at historically extreme valuations. The 40-year bond bull market is over. Real estate carries new structural risks. When you compare gold vs stocks vs real estate through a data lens, one asset class stands apart — and the macro conditions driving it are only getting stronger.
When Markets Crash, Gold Does This Every Time

Fear moves faster than greed — and gold has proven it across every major crisis of the last 100 years. Here’s what the historical record actually shows, from the Great Depression to COVID.
Gold Purchasing Power: What History Really Shows

The Roman suit myth says gold has always bought the same amount. The real history is more complicated — and far more revealing about where gold’s value is headed.
Gold Price Forecast 2026: What the Major Banks Are Predicting Now
Gold is 13% below its January all-time high — and every major bank is calling it a buying opportunity. This analysis covers 2026–2027 forecasts from J.P. Morgan, Goldman Sachs, Wells Fargo, UBS, and more, plus the five structural forces driving the rally.
The 1970s Gold & Silver Bull Run: Causes, Returns, and Lessons for Investors
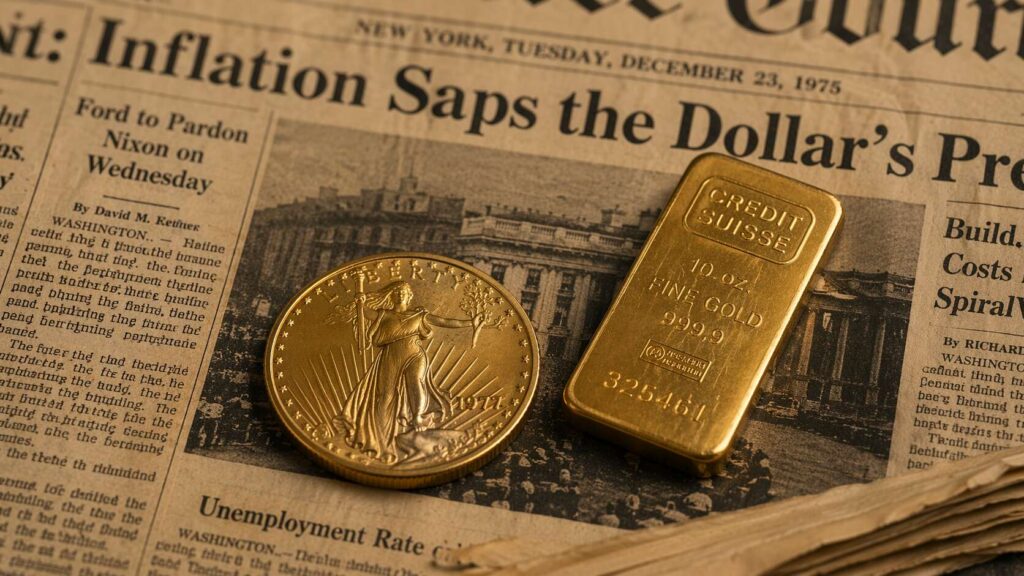
The 1970s gold and silver bull run remains one of the most dramatic wealth events of the 20th century. Gold rose 2,300%. Silver gained 400% in a single year. Understanding what drove that decade-long move — and what finally ended it — gives modern investors a precise framework for reading today’s precious metals market.
Gold Silver Ratio Forecast (75): Buy Gold, Add Silver, or Wait?
A gold-silver ratio of 75 signals silver is historically undervalued relative to gold. Discover what the data says, which metals to buy, and how to allocate your precious metals portfolio with confidence.
How to Read the Gold-Silver Ratio — And What to Do About It
The gold-silver ratio is one of the most practical tools in precious metals investing. It tells you when one metal is historically cheap relative to the other — and gives you a framework for acting on that signal without guessing at price direction.
