 Silver Rises Over 120% YTD




Gold Dips, Silver Holds as Iran Diplomacy Hopes Sink Oil Before a Bigger Week
Gold eased and silver held firm Monday as Trump’s openness to meeting Iran’s president knocked oil lower. The bigger test, the Trump-Xi summit, is still two days away.
Silver Round-Tripped a 6.8% Shock in Nine Days. Real Yields Did It, Not Inflation.
Silver closed at $67.28 on September 9, before a drone strike shut Saudi Arabia’s largest oil pipeline. Nine days and one Fed hike later, it is almost back. Most coverage credits fading inflation fear. The Federal Reserve’s own data disagrees: breakevens fell while real yields rose 22 basis points.
How Much Silver Should You Own? A Portfolio Allocation Guide by Age and Goal
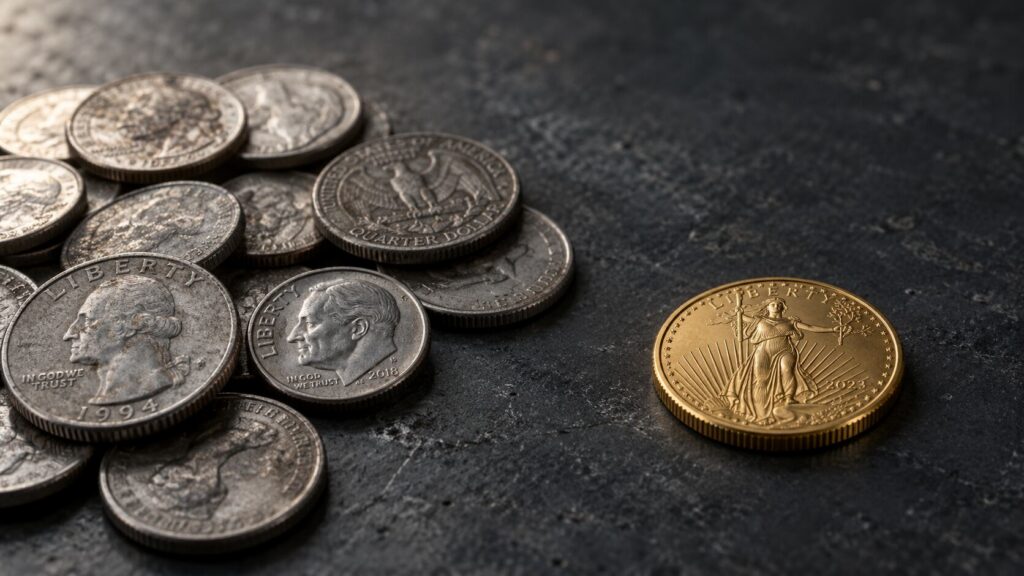
There is no Dalio-style institutional rule for silver the way there is for gold. This piece derives one using the live gold-silver ratio, silver’s dual monetary-and-industrial risk profile, and an age-and-goal framework that extends GoldSilver’s own gold-allocation guide.
Gold’s Tiny Output Is Worth Twice Aluminum’s. Here Are Four More Signals Like It.

Gold is choppy near $4,400 today, but four other signals say more: gold’s output value against aluminum, LBMA’s conference filling a month early, UBS’s structural buy case, and silver’s own outperformance.
Silver Price Prediction: One Bank Cut Its Target 30%, and the Reason Wasn’t the Fed
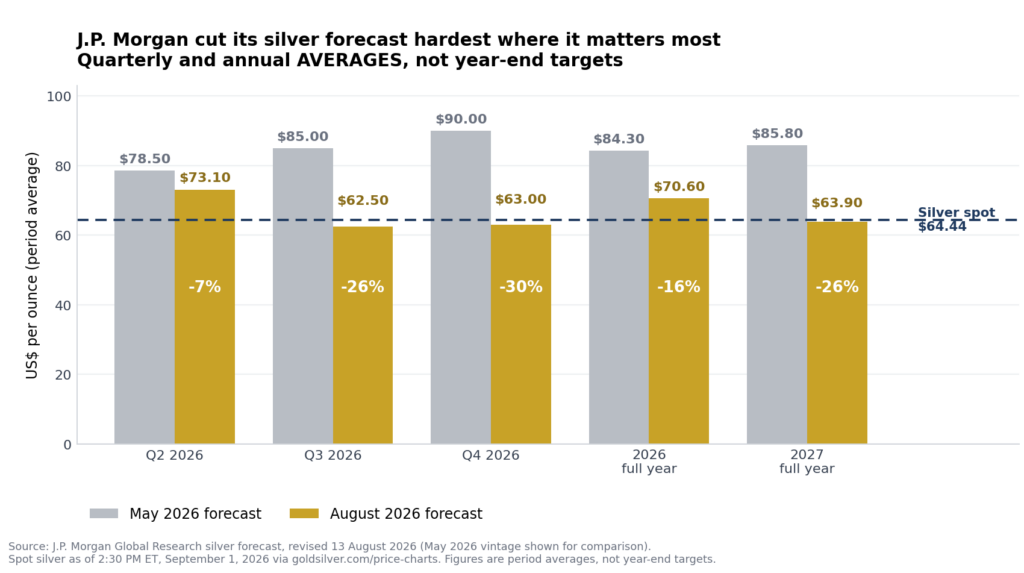
J.P. Morgan cut its Q4 silver forecast from $90 to $63, and silver already trades above it. The driver was solar demand, not the Fed. Gregory Shearer sizes the decline at roughly 60 million ounces, which is larger than 2026’s 46.3 million ounce deficit.
Gold Fell and Silver Rose on the Same Report. Here Is the Mechanism.
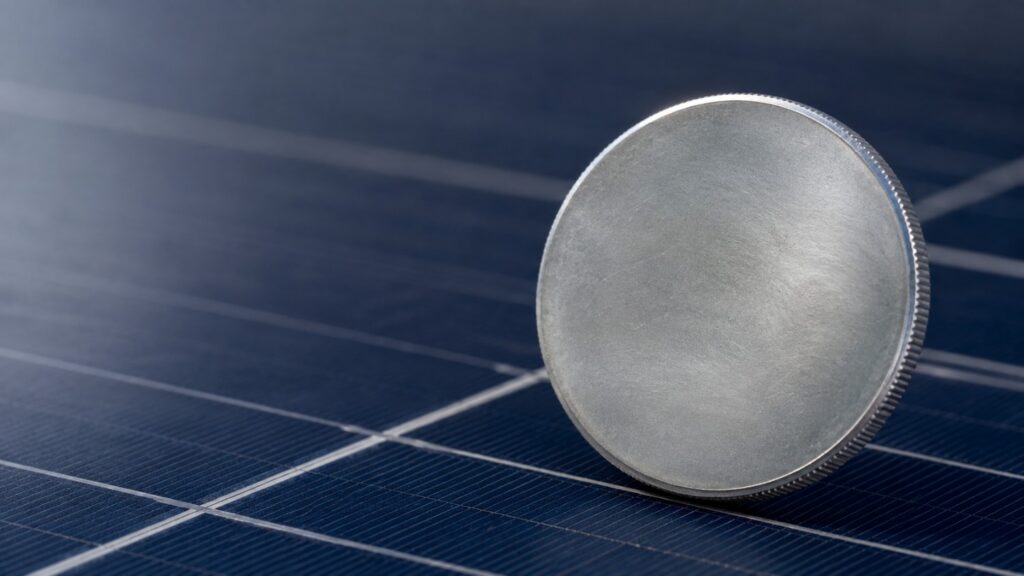
Gold and silver opened Thursday down together, then split after one 8:30 a.m. data batch. The Philadelphia Fed hit a five-year high and Treasury yields reversed higher. Gold stayed lower. Silver climbed anyway. The difference is mechanical.
Why Is Silver Outperforming Gold? A 6-Year Deficit
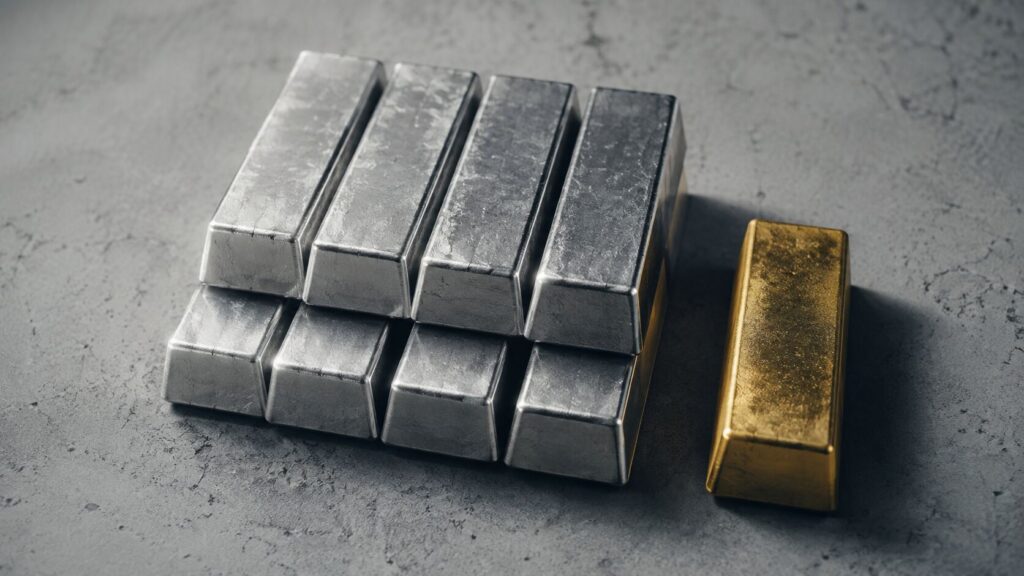
Silver is up 62% over the past year. Gold is up 26%. The gap isn’t a glitch — it’s the result of six straight years of supply deficits, soaring industrial demand from solar and EVs, and a gold-silver ratio that’s quietly been telling this story for months. Here’s why silver is doing what the textbook says it shouldn’t, and what it means for where prices go next.
Why Gold Is Holding Near $4,067 Ahead of a Jobs Week That Could Trigger a Rate Hike
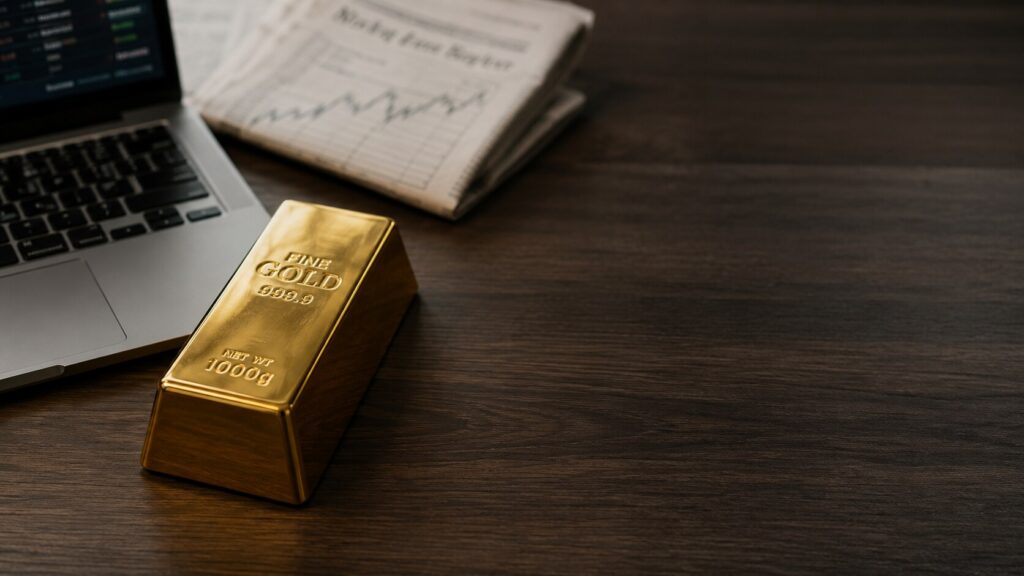
Everyone’s watching Friday’s jobs report expecting it to unlock rate cuts. This cycle it could do the opposite, with markets pricing roughly a 68% chance of a September rate hike, and gold is holding near $4,067 anyway. Here’s the stagflation bind behind gold’s resilience, and what to watch this week.
Gold Is Down $48. Here Are the Five Reasons Why.

Gold is down $48 today. Five separate market signals explain why — and they all point at the same question. Citadel Securities called a surprise Fed hike. WTI dropped below $80. Hike odds hit 35.8%. Goldman Sachs set a Brent target. Silver is underperforming. Here is the mechanism behind each one.
Gold Is Down 26%. Silver Is Down 51%. What Does the Stacker Do Now?
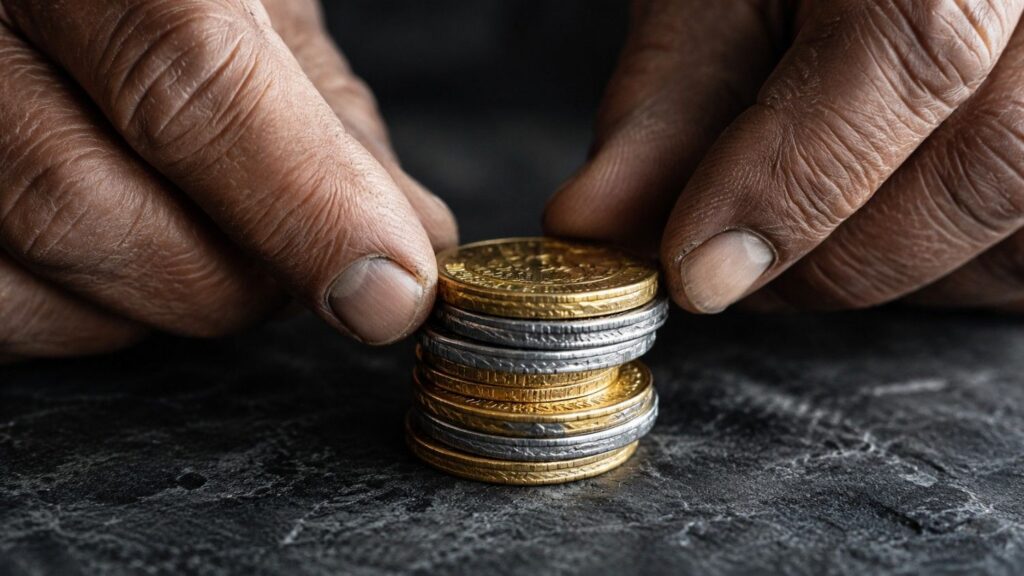
Gold and silver have pulled back sharply from their January 2026 peaks. The structural case — six consecutive silver deficits, 863 tonnes of central bank gold buying, and a gold-silver ratio above its long-run average — has not changed. This guide covers the floor thesis, how to read the GSR as a strategic compass, and how dollar-cost averaging turns volatility into an advantage.


