 Silver Rises Over 120% YTD




Gold’s 27% Drawdown Matches 2008 and COVID Almost Exactly. That’s Not a Warning.

Gold has fallen roughly 27% from its January 2026 high — almost identical to its drawdown in 2008 and during COVID. Both of those corrections resolved to significant new highs. Jeff Clark breaks down what history says comes next, why central bank buying hasn’t slowed, and the third historical parallel that makes this moment even more precise than either prior comparison.
Gold Price History: From $35 to $4,500 in 100 Years
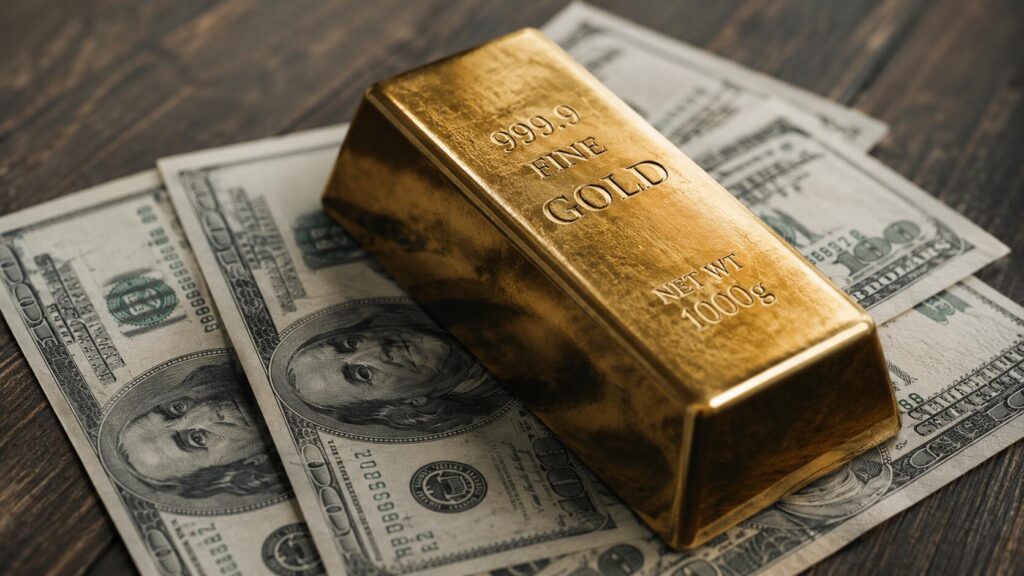
Gold went from $35 in 1971 to around $4,500 today — a 12,000% gain since the gold standard ended. Meanwhile, the dollar lost 96.9% of its purchasing power over the same period. These are not two separate stories. This is the complete gold price history: decade by decade, the real cause behind every major move, and what a century of data tells investors right now.
The Debasement Trade Explained: Mechanism, History, and What It Means for Gold
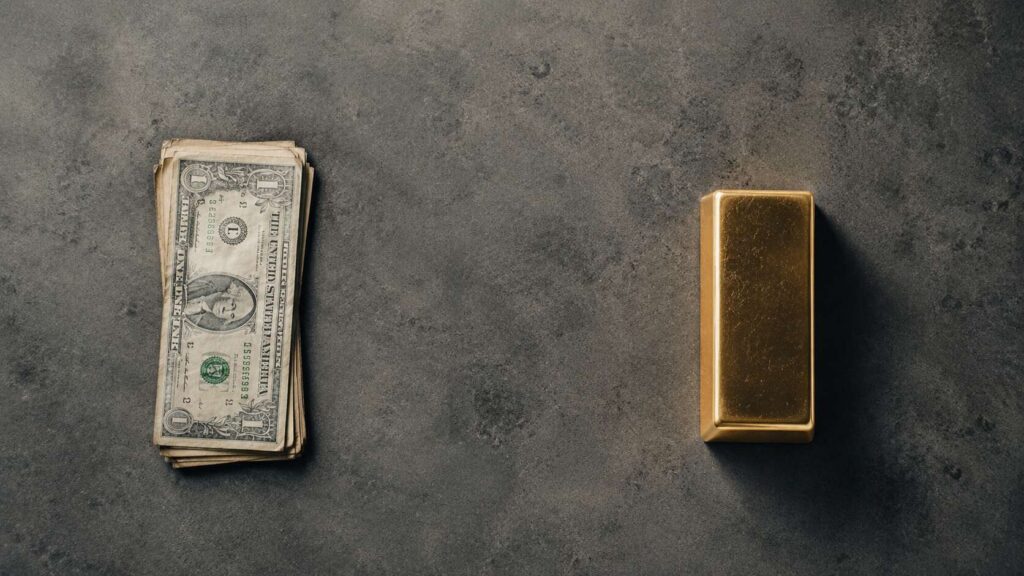
Five years ago, “debasement trade” was Austrian economics jargon. Today Goldman Sachs, Citi, and J.P. Morgan use it in their research notes. Here’s what it means, why it works, and why gold and silver are the primary instruments.
72% of Family Offices Hold No Gold. What They’re Missing.

Nearly three-quarters of the world’s most sophisticated investors hold no gold. The reasons are psychological, structural, and surprisingly relevant to your own portfolio decisions.
Gold Is Up 41% From a Year Ago. The Fed Can’t Stop It
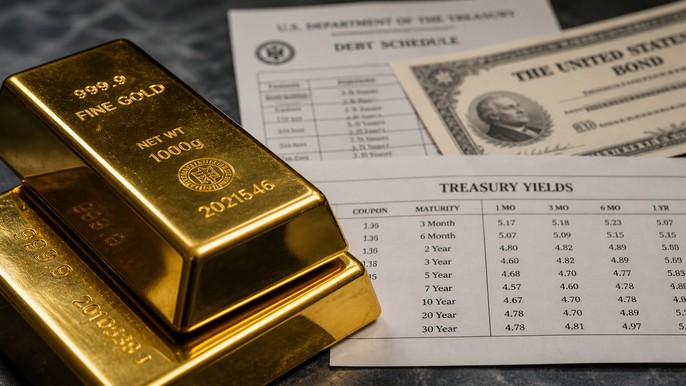
Gold is trading at $4,648/oz — up 41% from a year ago, down 14% from January’s record. Both numbers are true. The one that matters is the 41%. It held through a war, three hawkish Fed holds, and the most fractured FOMC vote since 1992. Here’s why that gap between the record and today’s price is a floor, not a warning.
Gold Purchasing Power: What History Really Shows

The Roman suit myth says gold has always bought the same amount. The real history is more complicated — and far more revealing about where gold’s value is headed.
Is Gold a Better Investment Than Bitcoin Right Now?
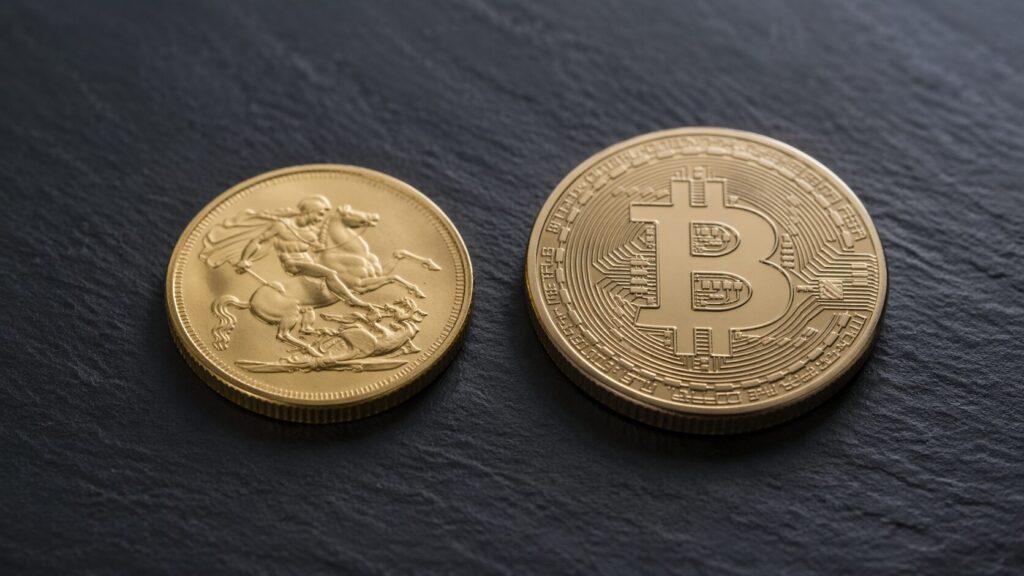
Gold hit an all-time high of $5,589 in January 2026 and has since pulled back 14%. Bitcoin is down more than 41% from its own 2025 record. The gap between those two numbers is the whole story.
Gold Is Down 10% From Its War-Peak — and Still Up 46% in a Year
Gold is down 10% from its war-peak — but up 46% in a year. The March PPI just hit 4.0%, the hottest since the conflict began. The headlines are telling the wrong story.
Gold Price Forecasts for 2026, Revisited After Q1

Gold prices are shaped by powerful forces — real interest rates, U.S. dollar strength, central bank demand, and geopolitical risk. This guide breaks down the key drivers behind gold future prediction, reviews a decade of historical performance, and outlines what investors should watch heading into 2026.
Why Western Investors Are Late to Gold’s Next Bull Market

Gold reached record highs even as Western ETF investors sat out. Here’s why: central banks and emerging markets have fundamentally changed who drives gold demand—and what that shift means for portfolio strategy going forward.


