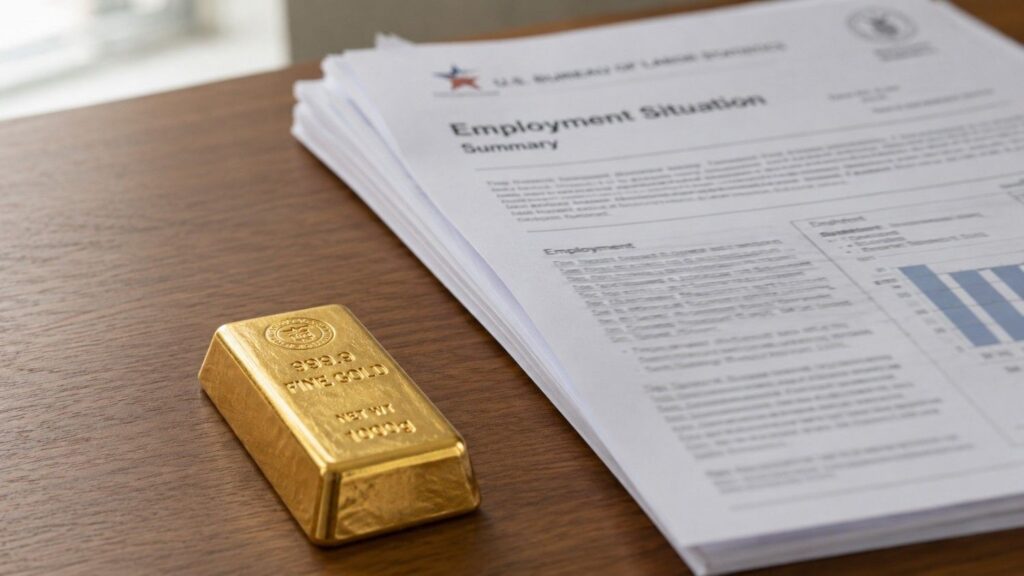
How the Jobs Report Moves Gold and Silver: The Five-Step Chain Behind Every Move

When the U.S. jobs report misses expectations, gold and silver prices typically rise. When payrolls beat, they fall. The relationship runs through a specific five-step chain — and once you understand it, the monthly reaction stops being a mystery.
Warsh Sat Out the Dot Plot. The FOMC Minutes Drop Wednesday.
The Federal Reserve releases the FOMC minutes from its June 16–17 meeting on Wednesday, July 8 at 2:00 p.m. ET. The committee came out nine to nine on whether to raise rates in 2026. Here is what the minutes will reveal — and why the real-yield mechanism makes them the most important data point for gold holders this week.
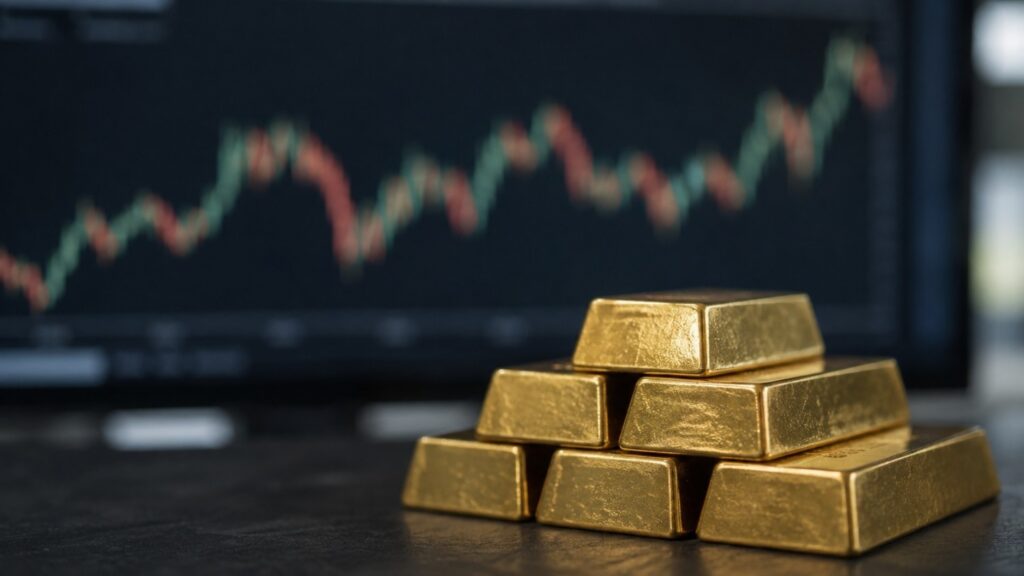
Gold Hits 3-Week High as Fed Hike Odds Halve on Jobs Miss
June’s jobs report added just 57,000 positions — less than half the forecast. Fed rate hike odds for July 29 fell to 22%. Gold hit a 3-week high. Here’s the mechanism.
ADP Missed. Gold Shrugged. Warsh Is Live in Sintra Right Now.
ADP’s June jobs report missed forecasts, but the gold price barely moved. Fed Chair Warsh is speaking live in Sintra right now, with Thursday’s jobs report still ahead.
172,000 Jobs Doubled the Forecast. Thursday’s Report Could Move Gold Again.
Every month, one government report moves gold’s paper price more than almost anything else. Thursday’s June jobs report is no different. Here’s the mechanism behind the move — and a three-scenario framework for what each outcome means for gold before 8:30 AM ET.
The Dot Plot Has 18 Dots. The Chair Withheld His.

The Fed’s June dot plot had 18 projections, not 19. Chair Warsh withheld his. The split is 9-to-9 — not the hawkish mandate markets have priced into gold.
Gold Price News: Goldman, China, CPI, and the Fed Explained
Goldman Sachs just pushed every 2026 rate cut to 2027. China’s central bank bought gold for the 19th month in a row. CPI drops Wednesday. A fragile ceasefire is holding — barely. And silver just had its worst week relative to gold in months. Here is what each story means for precious metals investors.
Gold Near $4,330 as Rate-Hike Bets Hit 70% and China Acts
Five forces are moving gold and silver right now. Strong U.S. jobs data has pushed Fed rate-hike odds above 70%. China’s biggest banks raised gold trading margins to 120% — pushing leverage below 1x. The People’s Bank of China extended its buying streak to 19 straight months. Iran announced an end to its military operation against Israel, steadying metals after last week’s 5% pullback. And elevated oil is keeping inflation expectations alive. Here is what each one means for long-term precious metals holders.
Silver Falls 6% on Jobs Beat. The Six-Year Deficit Didn’t.

Silver fell nearly 6% after May’s blowout jobs report sent rate hike odds to 67% and the 10-year Treasury to 4.54%. Gold dropped too — but only half as much. Here’s why: silver runs on two engines. The jobs report hit the monetary one hard. The industrial one — solar, EVs, AI infrastructure — didn’t flinch. And the World Silver Survey 2026 deficit of 46.3 million ounces? Unchanged. One Friday’s data moves prices. It doesn’t move ounces.
Gold Rate Hike Fears Are Weighing on Prices. Here’s the Full Picture.

Gold slipped to $4,448 this week as rate-hike fears and Middle East tensions drove a 2% weekly loss. Central banks bought 244 tonnes in Q1 2026 — yet retail demand has cooled sharply. With May jobs data due today and gold holding just above its 200-day moving average, here is what five key developments mean for anyone holding precious metals right now.
