 Silver Rises Over 120% YTD




Gold Is Down 22% — The Same Drop as 2022. The Floor Is Not the Same.
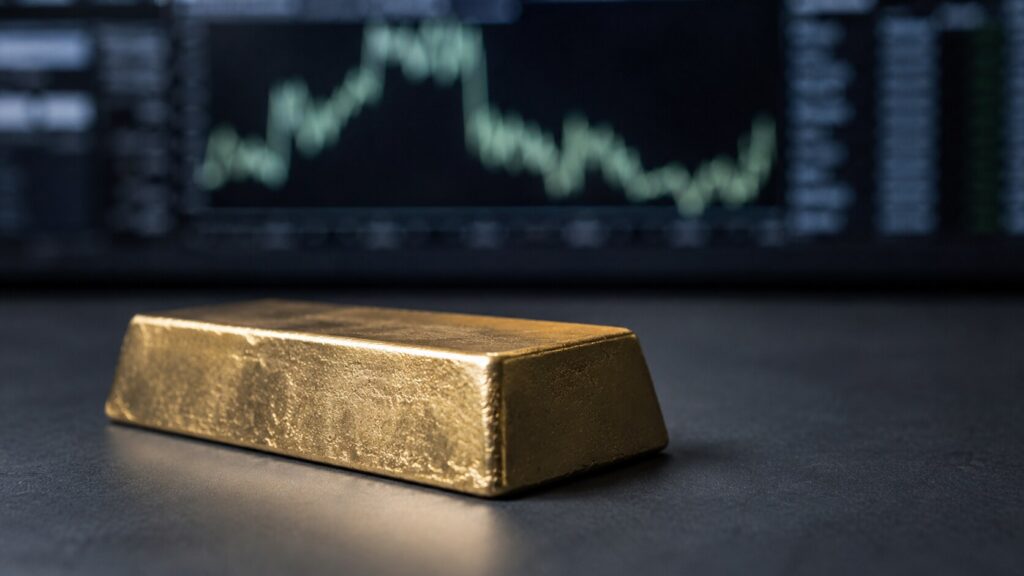
Gold has fallen 22% from its January 2026 all-time high of $5,589 — the same magnitude as the entire 2022 Fed hiking cycle. But in 2022, the Fed delivered 525 actual basis points of rate increases. Today, markets are pricing roughly a 43–50% probability of a single speculative hike that hasn’t happened yet. Same number. Very different floor. Here’s what the gap between those two corrections is telling long-term holders of physical gold.
Gold at $4,480: Physical Demand Hits a 50-Year Milestone
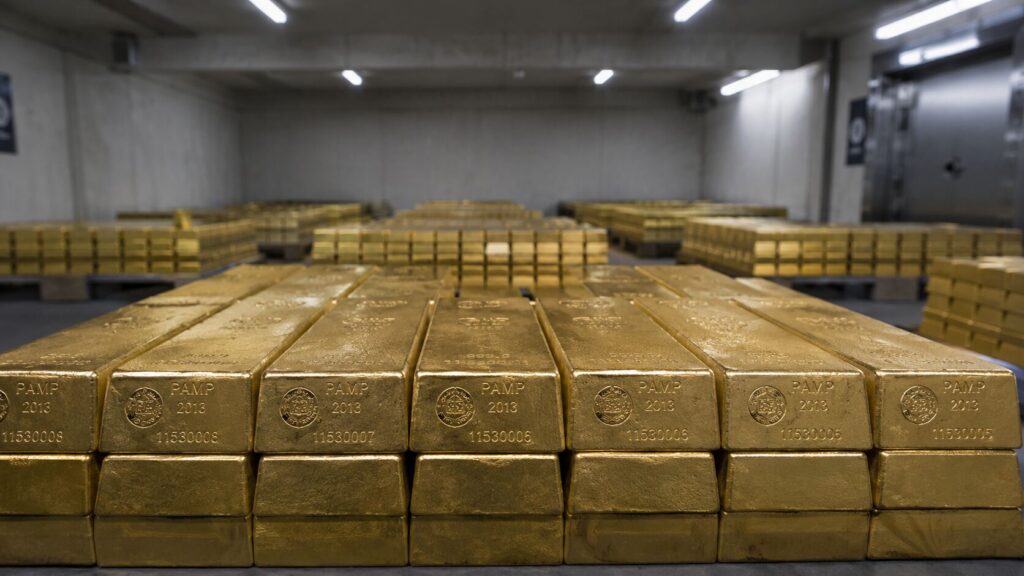
Central banks reshape gold markets through the most concentrated sovereign buying in decades — but that’s only one of five forces moving gold right now. Physical investment is overtaking jewelry demand for the first time on record. Russia’s figures don’t add up. China just hit the brakes. Here’s what’s driving the market.
Gold Confiscation: Could the Government Take Your Gold Again?
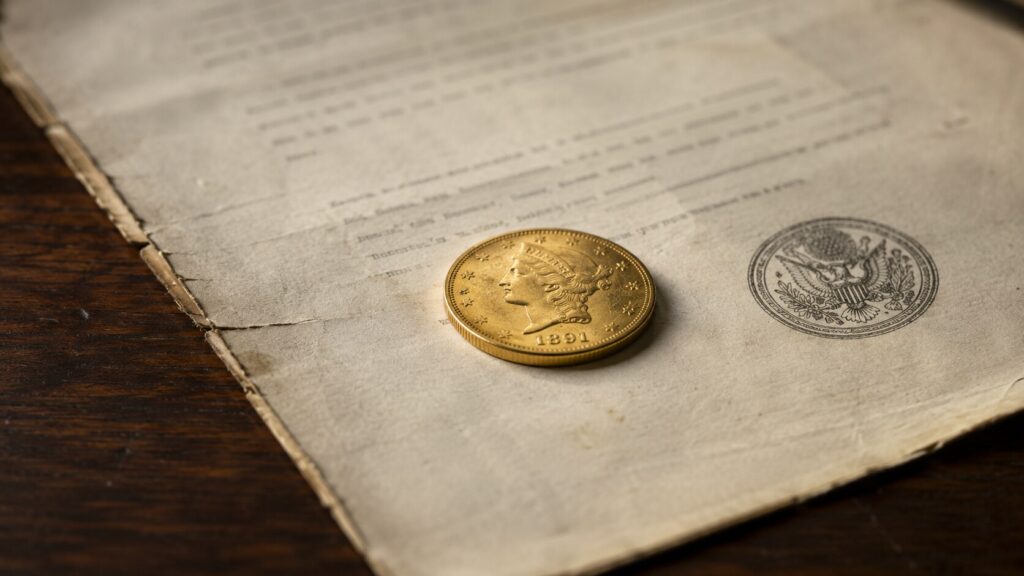
In 1933, the US government ordered Americans to surrender their gold at $20.67 an ounce — then revalued it to $35 and kept the difference. It was legal. It worked. But five major crises have passed since private ownership was restored in 1975, and confiscation has not happened once. Here is what actually changed, why the legal bar is now substantially higher, and what modern allocated ownership means for the question every gold investor eventually asks.
Gold at $4,454 Says the Fed Is Trapped. Here’s Why.
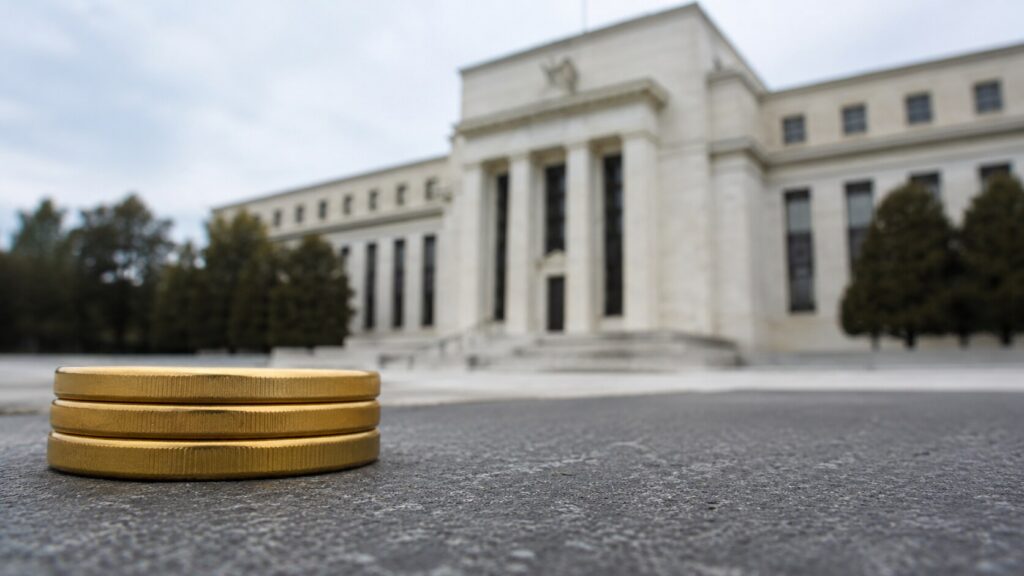
Friday’s jobs report doesn’t just move gold for 48 hours. This time it sets the stage for Kevin Warsh’s first FOMC meeting, a divided committee, and 3.8 percent inflation the Fed can’t cut through. Three scenarios. One structural trap. Here’s the framework before the number drops.
Factory Costs Hit 82.1. That Number Is Now Working for Your Gold.
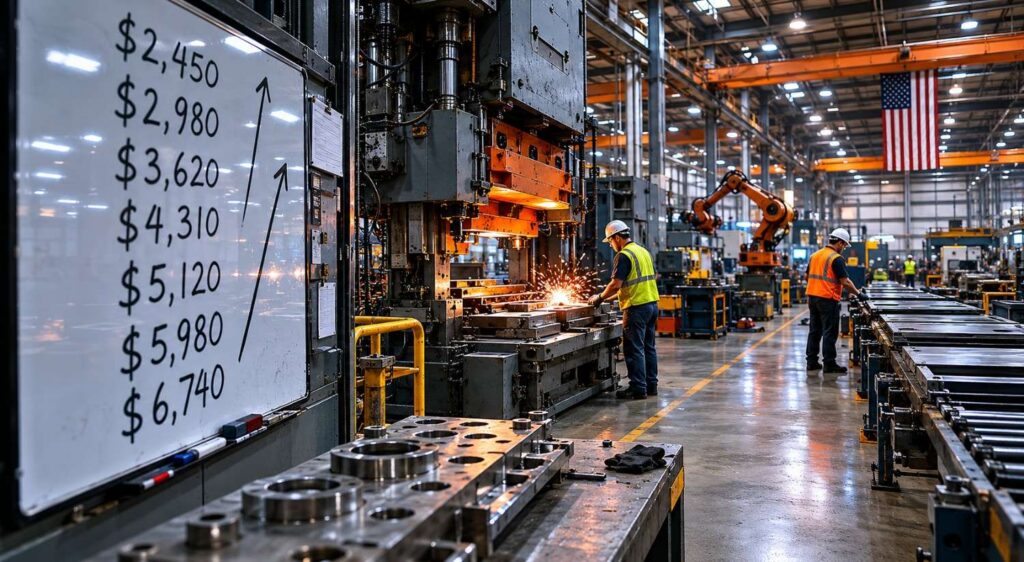
The ISM Manufacturing Prices-Paid Index hit 82.1 in May — the second-highest reading since 2022 and the 20th consecutive month of rising factory costs. Most headlines covered the manufacturing boom. Almost nobody explained what the prices-paid number means for the Fed, for inflation this summer, and for the structural case for holding gold.
Gold Price History: From $35 to $4,500 in 100 Years
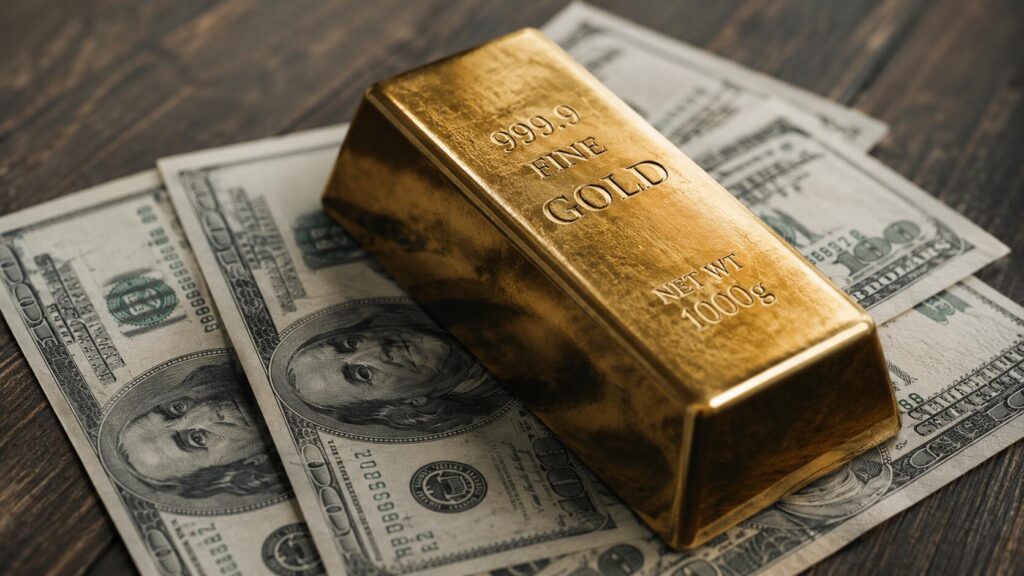
Gold went from $35 in 1971 to around $4,500 today — a 12,000% gain since the gold standard ended. Meanwhile, the dollar lost 96.9% of its purchasing power over the same period. These are not two separate stories. This is the complete gold price history: decade by decade, the real cause behind every major move, and what a century of data tells investors right now.
Gold at $4,500: What Fort Knox, China, and Silver Are Telling You
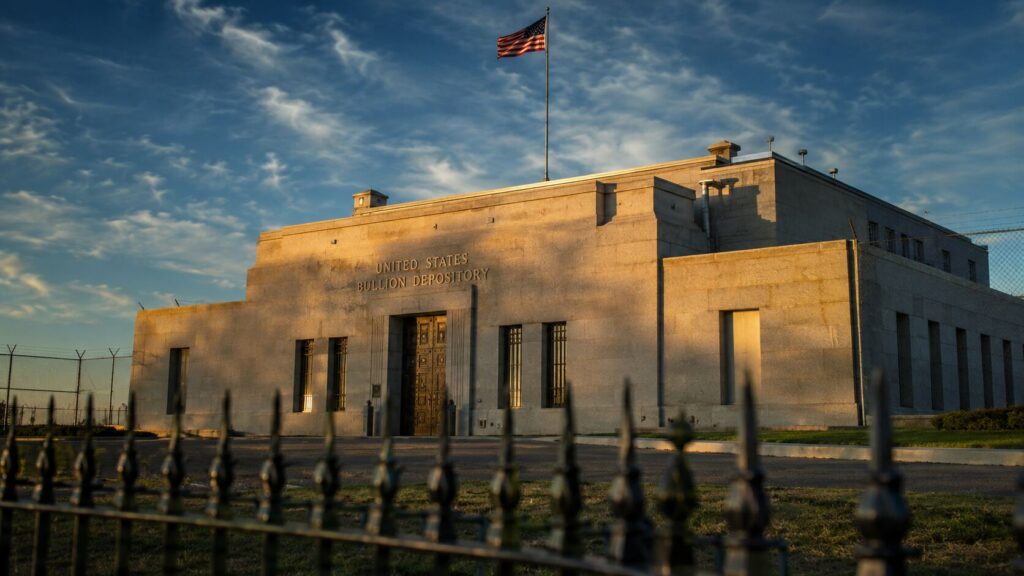
Fort Knox holds $662 billion in gold not independently audited since 1953. China has bought gold for 13 straight months. Manufacturers are signaling inflation isn’t finished. Fourteen states just made gold and silver constitutional money. And silver is outperforming gold 2:1 today. Five stories. One through-line. Here’s what they mean for your metals.
The Debasement Trade Explained: Mechanism, History, and What It Means for Gold
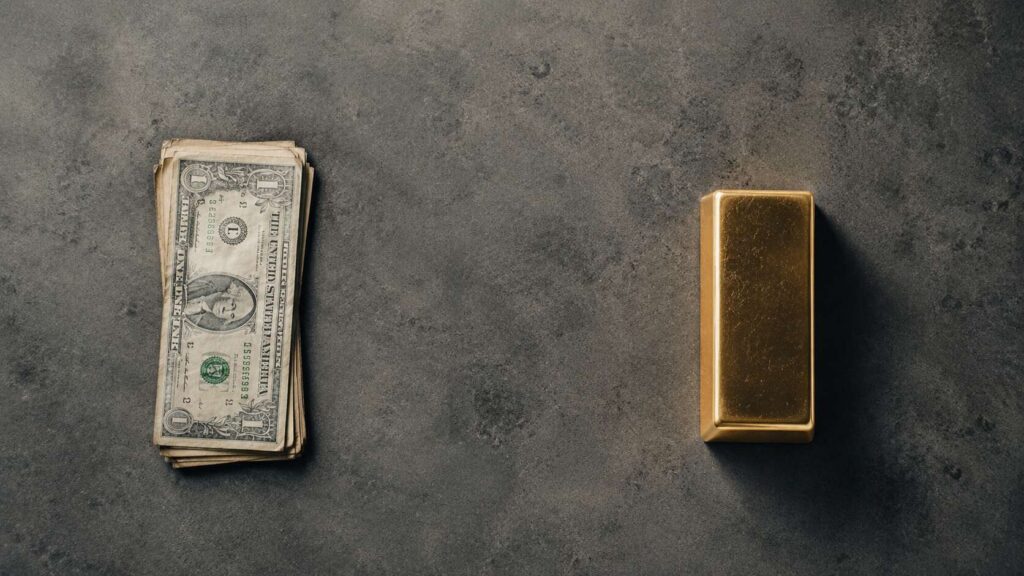
Five years ago, “debasement trade” was Austrian economics jargon. Today Goldman Sachs, Citi, and J.P. Morgan use it in their research notes. Here’s what it means, why it works, and why gold and silver are the primary instruments.
The Buyer List for Gold Just Got Longer. These Countries Have Never Bought Before.
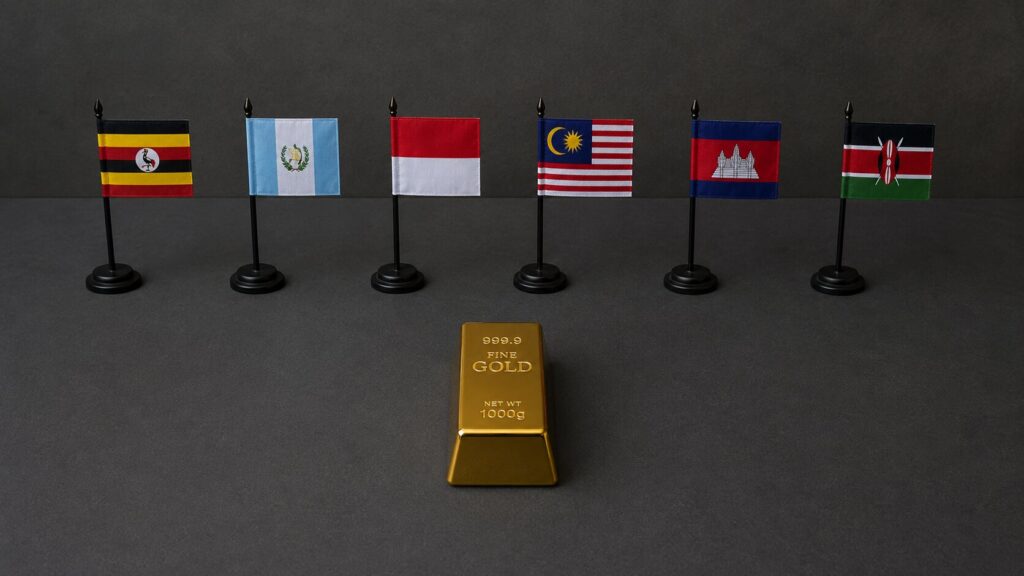
Central banks purchased a net 244 tonnes of gold in Q1 2026 — and for the first time, the buyer list includes countries like Guatemala, Indonesia, Malaysia, Cambodia, Uganda, and Kenya. Some are buying gold for the first time in their institutional history. Others are returning after decades of absence. Here is what the world’s most sophisticated reserve managers are telling you by voting with their balance sheets.
Gold or Silver First? A First-Time Buyer’s Framework
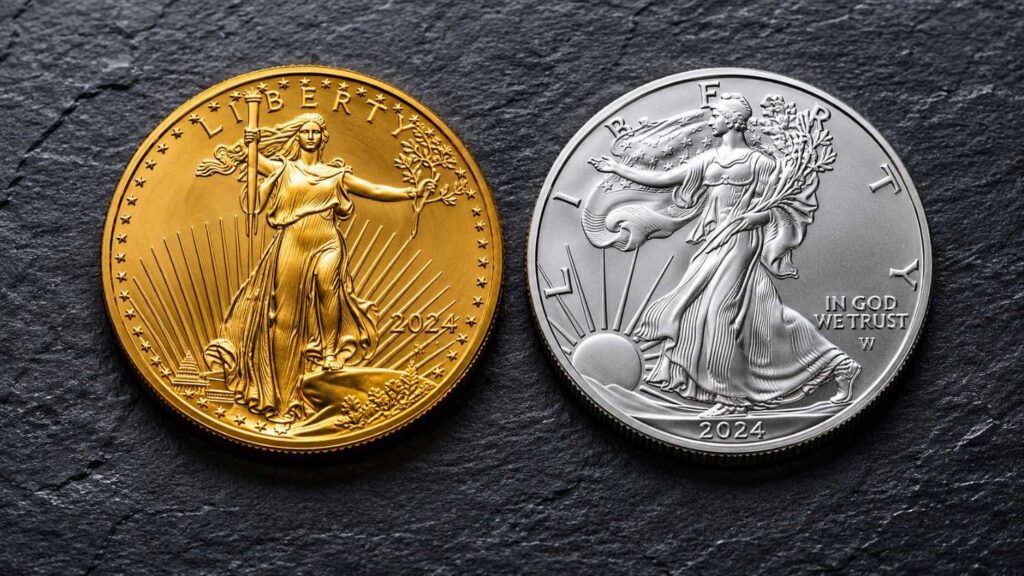
Most guides tell you gold is safer and silver is cheaper. That’s true and useless. This 4-question framework maps your budget, goals, storage, and liquidity needs to a clear starting point — so your first precious metals purchase is the right one.


