Gold Price Outlook: Oil Futures Disagree With Stock Markets
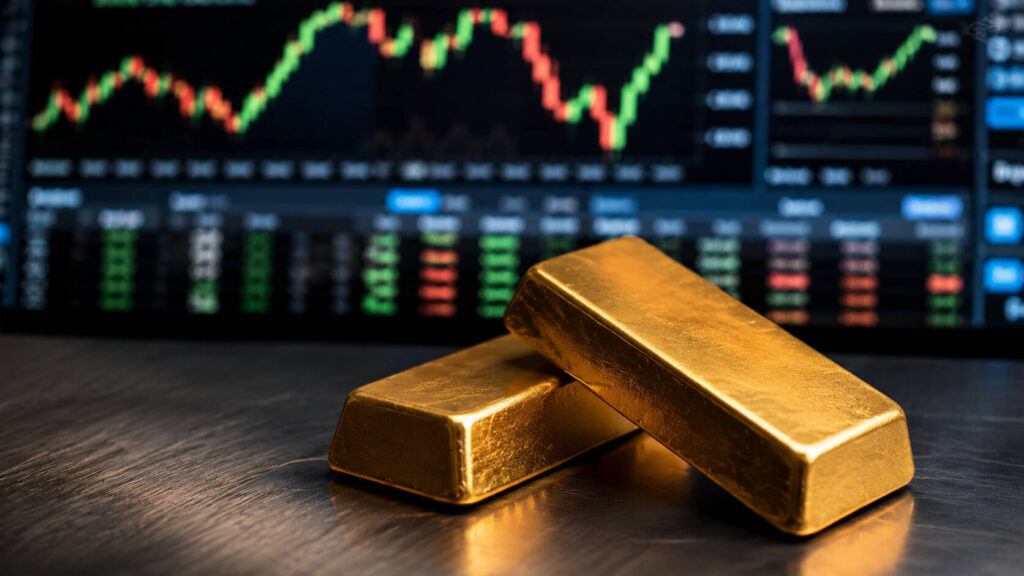
The World Gold Council’s April commentary carries a loaded title: “The Return of Transitory.” It’s a warning — equity markets have priced the Iran-Hormuz crisis as a passing shock, but oil futures are pricing a 22–25% premium over pre-crisis levels through year-end. One of those markets is wrong, and that gap is the most important signal in gold right now.
$5,500 Gold by Q1 2027? The Central Bank Risk Driving It
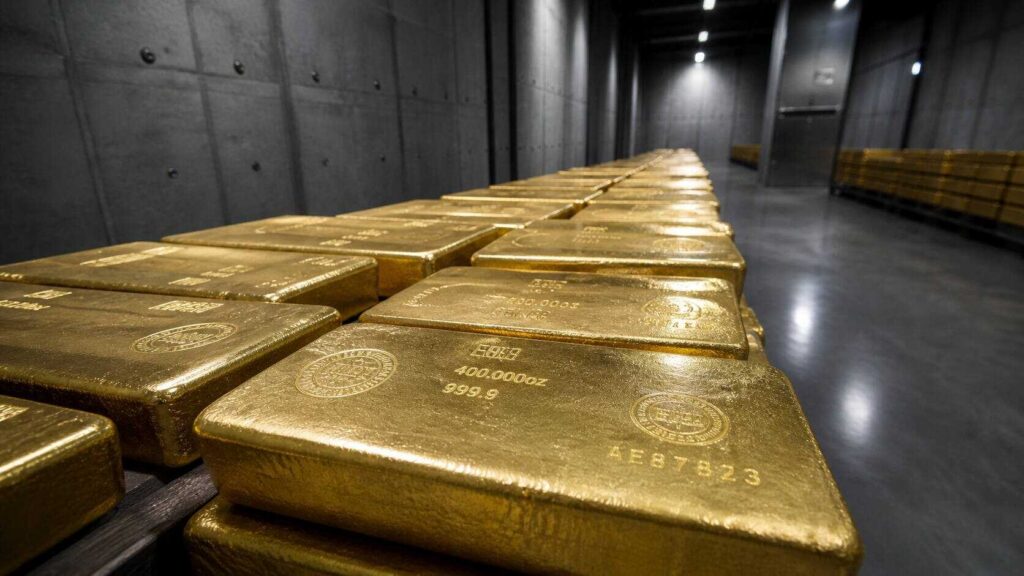
Gold has pulled back 18% from its January 2026 all-time high of $5,589.38. But structural forces — central bank buying, policy uncertainty, and dollar weakness — are pointing toward $5,500 by Q1 2027.
Gold Price and the Jobs Report: A Pre-Market Guide
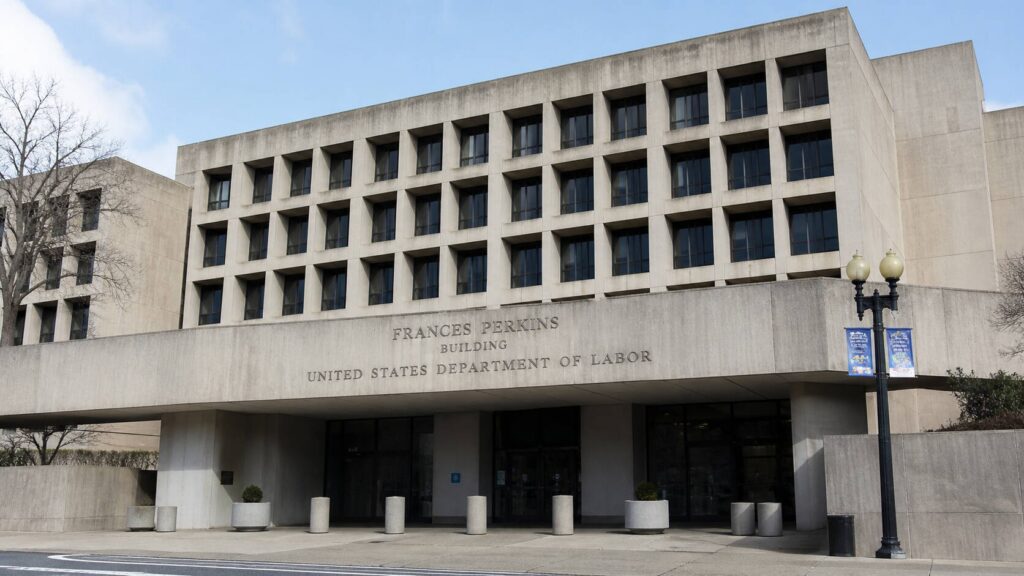
Economists expect just 49,000 jobs on May 8 — down from 178,000 prior. Before the number drops, here are the three scenarios every gold investor needs to understand, and what each one means for gold price.
PCE at 3.5%, GDP Miss: Why This Is Bullish for Gold

PCE inflation hit 3.5% in March — the highest since May 2023 — while Q1 GDP grew just 2.0%, missing the 2.2% forecast. Four central banks held rates the same morning, with two signalling they discussed hikes. When growth slows and inflation stays hot, the Fed is trapped. That trap has historically been the strongest environment for physical gold and silver.
What’s Driving Gold Prices? Oil, PMI, and Newmont

Five market stories from April 23, 2026 — and what they mean for gold and silver holders. From Trump’s Hormuz escalation to Newmont’s cost data, each brief connects today’s news to the structural case for holding physical precious metals.
