Published: 04-22-2026, 09:44 am | Updated: 04-22-2026, 11:11 am
Gold and silver market update — April 22, 2026
Key Takeaways
- The gold-silver ratio signal cuts both ways. When silver outperforms gold, industrial demand and safe-haven demand are active at the same time — a rare combination that has historically preceded sustained precious metals momentum.
- The supply deficit is structural, not cyclical. The Silver Institute projects a sixth straight annual deficit in 2026, with 762 million troy ounces drawn from above-ground stocks since 2021. Physical silver is getting harder to source, and the buyer base is growing.
- Silver’s 34–35% discount from its all-time high sits against a tightening market. The Fed is frozen, real returns on cash are negative, and industrial demand from solar and AI keeps rising. The price reflects geopolitical noise. The underlying fundamentals have not changed.
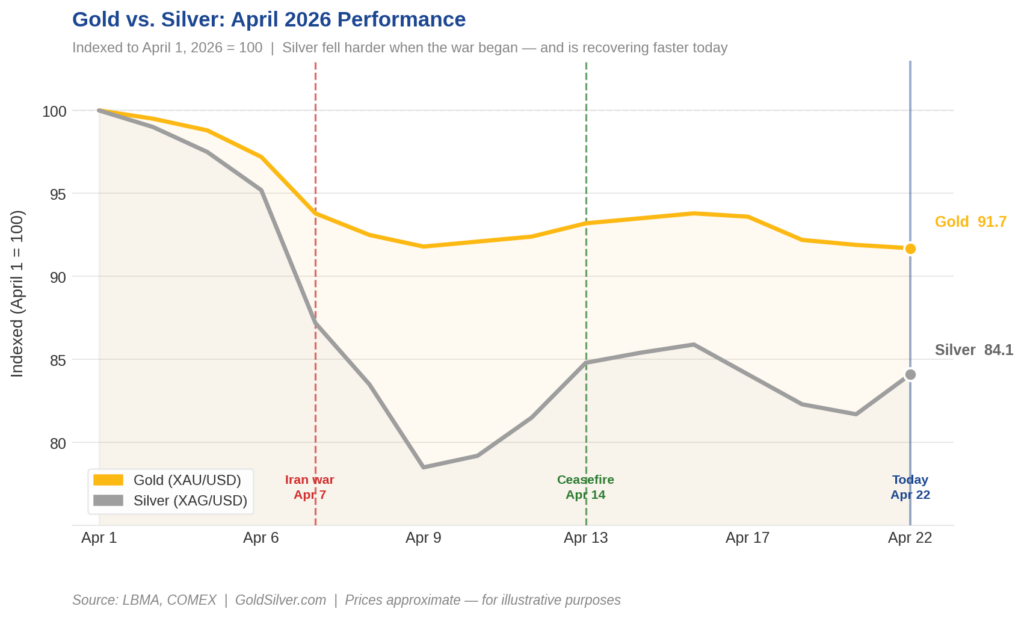
Silver is up more than 2% this morning. Gold is up 1%. That gap isn’t noise — it’s the market pricing two separate stories at once. One is a safe-haven story. The other is an industrial story. For the first time in weeks, both are moving in the same direction.
Gold is trading near $4,770 per ounce as of early Wednesday morning ET, recovering from Tuesday’s selloff after President Trump extended the US-Iran ceasefire. Silver is trading around $79–$80 per ounce — up twice as much as gold on the same headline.
When silver outperforms gold, it sends a specific signal. Most investors miss it.
What Does the Gold-Silver Ratio Actually Signal?
The gold-silver ratio tracks how many ounces of silver it takes to buy one ounce of gold. It is one of the oldest signals in precious metals markets — and one of the most misread.
When gold beats silver, investors are rotating toward pure monetary safety. Silver beating gold tells a different story: the safe-haven bid is still active, but the industrial demand story is being priced in too.
Today is the second kind of day.
Silver has two jobs that gold doesn’t. According to the Silver Institute’s World Silver Survey 2025, industrial use accounts for roughly 58% of total annual silver demand — solar panels, electronics, AI data center components, and medical devices. That demand is structural, not cyclical.
The supply picture adds another layer. The Silver Institute’s World Silver Survey 2026 (April 15, 2026) projects a sixth straight annual deficit — a shortfall of 46.3 million troy ounces, up 15% from the prior year. Since 2021, the total drawdown from above-ground silver stocks has reached 762 million troy ounces — about a full year of global mine output. Supply has not caught up, and it shows no sign of doing so.
So when silver gains 2% in today’s environment — ceasefire extended, Strait of Hormuz still largely shut — the market is buying both the safe haven and the recovery. That mix rarely appears together. When it does, it tends to matter.

The Edge Every Investor Needs Smarter precious metals investing starts here. The Nuggets Newsletter brings you essential market insights, Fed updates, global trends, educational videos, and much more.
Why Did Silver Fall So Much Harder Than Gold?
Silver hit an all-time high of about $121.60 per ounce on January 29, 2026. Since the US-Iran war began on February 28, it has fallen more than 15%. Gold, over the same period, is down roughly 8–10%.
That gap is not random. Silver responds to two demand drivers, not one. Monetary demand protects it when inflation rises or confidence in fiat currency falls. Industrial demand — that 58% of total use — weakens when investors expect a slowdown. In contrast to gold, silver got caught on both fronts when the Iran war began.
The conflict pushed oil toward $90 per barrel. Inflation fears grew. Rate-cut hopes collapsed. Growth forecasts fell sharply. As a result, the demand outlook for silver dropped fast — on top of the monetary pressure that hit gold too.
Gold, driven almost entirely by monetary dynamics, held up better.
Today’s move suggests that pressure is easing. Trump’s ceasefire extension — open-ended, pending a unified Iranian proposal — removed the immediate re-escalation risk. That was enough. Silver buyers returned, and this is now the fourth straight week of gains.
Is China’s Silver Demand a Short-Term Trade or a Long-Term Structural Story?
Structural, without question. China’s silver consumption flows directly from its clean energy buildout — solar panels require silver in their cells, and China’s solar manufacturing capacity is among the largest in history.
According to the Silver Institute’s World Silver Survey 2025, China posted the largest manufacturing demand increase for silver of any country in 2024 — up 7% year-on-year. That expansion shows no sign of slowing. However, it now runs into a market where supply has failed to keep pace with demand for six years straight.
Physical silver is getting scarcer. The buyers are growing in number.
At $79–$80, Is Silver Cheap Relative to Its Fundamentals?
Most financial media will frame today’s move as a commodity bounce tied to geopolitical relief. That reading is accurate, but it is also incomplete.
Silver is not just a manufacturing input. It is sound money — a physical asset that has held its value across 5,000 years of monetary history. At $79–$80, it sits 34–35% below its January 2026 peak. That discount exists alongside a sixth straight supply deficit, a total stock drawdown of 762 million troy ounces since 2021, and rising demand from clean energy and AI.
Moreover, the broader monetary backdrop reinforces the case. The Federal Reserve is holding rates at 3.50–3.75%. It cannot cut while oil-driven inflation persists. Cash earns less than inflation in real terms. That makes the cost of holding silver — a non-yielding asset — low, while the case for owning it stays high.
Stay On Top of Gold & Silver Prices
Get important market alerts sent straight to your inbox.
SOURCES
1. LBMA — Precious Metal Prices
2. LBMA — Precious Metals Market Report: Q1 2026
3. Trading Economics — Silver Commodity Data
4. Silver Institute — Silver Supply & Demand (World Silver Survey 2025)
5. World Silver Survey 2026 — Silver Institute (April 15, 2026)
6. Silver Industrial Demand Reached a Record 680.5 Moz in 2024 — Silver Institute
7. Federal Reserve — FOMC Statement, March 18, 2026
8. CME Group — NYMEX WTI Crude Oil Futures
By the GoldSilver Editorial Team — helping investors understand sound money since 2005. This article is for informational purposes only and does not constitute financial, investment, or tax advice. Always consult a qualified financial advisor before making investment decisions.
You May Also Like:
- Gold Drops to $4,681 — Iran Ceasefire Expires Today
- The Real Reason Gold Is Down During an Oil War
- What the Warsh Hearing Means for Gold Prices
- IMF Says Treasuries Aren’t Safe Anymore. Gold Noticed First.
- Gold Price After Ceasefire Violation: The Floor Has Moved
- Oil Crashed 11%. Gold Went Up. That Tells You Everything.
- $1 Trillion in Debt Interest Is Why Gold Keeps Climbing
- 5 Signals That Say Gold’s Bull Case Just Got Stronger