Published: 04-21-2026, 09:38 am | Updated: 04-21-2026, 09:46 am
Gold and Silver market update – April 21, 2026
Key Takeaways
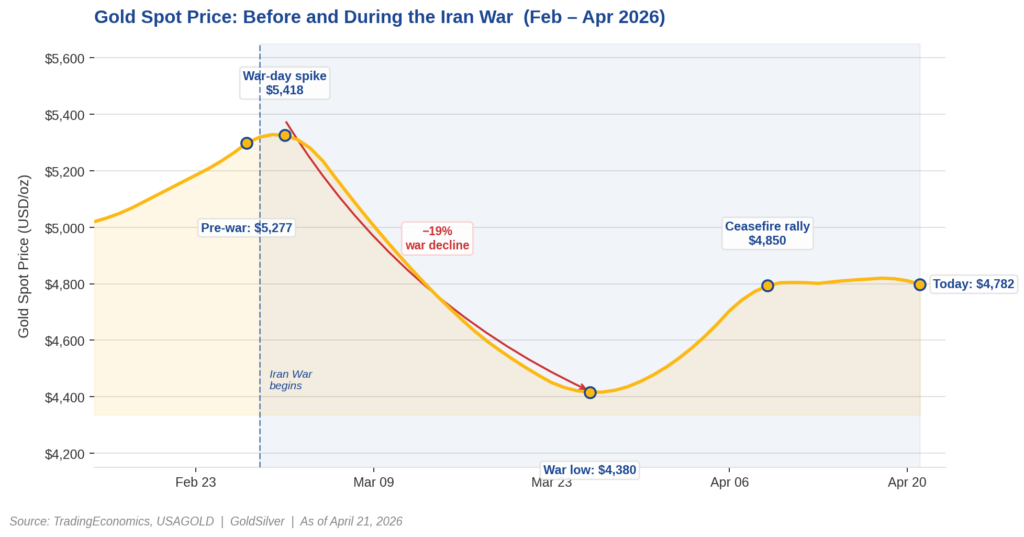
- Gold is down ~10% since February 28 — not because the sound money thesis broke, but because the war drove oil higher, killed rate-cut expectations, and suppressed paper gold through the real yield mechanism.
- Paper and physical diverged. Paper gold (futures, ETFs) sold off on macro repricing. Physical premiums widened and demand held firm, per USAGOLD. The spot price dip reflects ownership structure, not underlying value.
- The fiscal case is untouched. A ~$1.9T annual deficit and ~$1T in annual debt service (CBO) are unaffected by any ceasefire. Fiscal dominance — the structural cap on real yields — remains the primary multi-year driver for gold.
- The suppression reverses when oil falls. Lower oil → lower CPI → rate-cut expectations return → real yields compress → paper gold recovers. Natixis puts the war’s price drag at up to $750/oz — that’s the gap that starts closing.
- Silver is leading the recovery. Up ~31% from its March war low of ~$61 to ~$79.90 as of April 21 (TradingEconomics). The gold-silver ratio compressed from ~90x to ~60x — near its long-run mean.
Since the Iran War began on February 28, 2026, gold is down roughly 10%. Oil, meanwhile, is up nearly 60%. By the conventional logic, the metal should be rallying. It isn’t — and the reason why matters more than the price move itself.
Why Is Gold Falling During an Inflation Shock?
Gold is falling because the Iran War triggered a specific chain reaction. First, oil spiked. As a result, inflation fears reignited. Consequently, rate-cut expectations died — the Federal Open Market Committee held at 3.50–3.75% in March, and CME FedWatch shows a 99.5% probability of another hold on April 28–29. Gold pays no yield. So when rates stay high, holding it costs you something. Institutional investors sold.
The reason comes down to real yields. The metal tracks real yields — nominal bond returns minus inflation expectations — more closely than it tracks inflation alone. In other words, when energy prices drive inflation higher and keep the Fed restrictive, real yields stay elevated and paper gold falls. This is not the sound money thesis failing. Instead, it is the thesis operating in a macro regime it was never designed to escape quickly.

The Edge Every Investor Needs Smarter precious metals investing starts here. The Nuggets Newsletter brings you essential market insights, Fed updates, global trends, educational videos, and much more.
What Is the Difference Between Paper Gold and Physical Gold?
Paper gold — COMEX futures, SPDR Gold Shares (GLD), iShares Gold Trust (IAU) — trades like a financial asset. It responds to rate expectations, margin calls, and institutional risk models. So when the war changed the rate calculus, funds sold and the spot price fell.
Physical gold, however, responded differently. Dealer premiums — the markup above spot on coins and bars — widened as paper prices dropped, according to USAGOLD’s daily market reporting. Physical demand held firm. The person who bought gold eagles in March wasn’t selling them back because a futures desk repriced its inflation model.
That’s why it matters which kind you own.
Does the Iran War Change the Long-Term Case for Gold?
No — because the forces driving the metal over a 3–5 year horizon are fiscal, not geopolitical. Specifically, the US runs a deficit of roughly $1.9 trillion annually and pays approximately $1 trillion per year in debt interest, per Congressional Budget Office projections. No ceasefire touches those numbers.
The key mechanism here is fiscal dominance: a debt burden so large that the Fed cannot raise rates aggressively without triggering a debt-service crisis. As a result, this constrains every Fed chair regardless of ideology and means real yields are structurally capped over a multi-year horizon. The war is a chapter. Fiscal dominance is the book.
The obvious pushback: if the Fed holds at 3.50–3.75% through 2027, real yields stay elevated and paper bullion faces a genuine headwind. True. However, that argument ignores the arithmetic. Treasury issuance is at record pace. Moreover, debt service is consuming a rising share of federal revenue. The window for maintaining truly restrictive real yields therefore narrows — not by policy choice, but by fiscal constraint.
What Happens to Gold When the War Ends?
History offers a useful parallel. The 1973–74 Arab oil embargo ran the same playbook — energy shock, inflation spike, Fed on hold, and bullion underperforming the inflation narrative — until the rate environment broke and the metal surged. One key difference this time: in 1974, the US wasn’t running a $1.9 trillion annual deficit.
According to Natixis analyst Bernard Dahdah, the war’s suppression effect on gold is “as much as $750 per ounce.” When oil falls and rate-cut expectations return, the metal has a long way to recover. Furthermore, that’s before the fiscal debasement thesis gets priced in on top.
Silver is already showing what that move looks like. From a war low of roughly $61 around March 23, it recovered to ~$79.90 by April 21 — a 31% move that outpaced gold, per TradingEconomics. Additionally, the gold-silver ratio compressed from ~90x to ~60x over the same period, returning near its long-run mean.
In the near term, watch three dates: tonight’s ceasefire expiry, the April 28–29 FOMC (Powell’s final meeting as chair), and the University of Michigan inflation expectations print on April 24. A sustained ceasefire combined with falling oil is the clearest path back toward where gold was before this war started.
Stay On Top of Gold & Silver Prices
Get important market alerts sent straight to your inbox.
SOURCES
1. CME Group — CME FedWatch Tool
2. Congressional Budget Office — The Budget and Economic Outlook: 2026 to 2036
3. Congressional Budget Office — Director’s Statement on the Budget and Economic Outlook: 2026 to 2036
4. Kitco News — Daily Gold Market Reports
5. TradingEconomics — Gold Spot Price Historical Data
6. U.S. Energy Information Administration — Crude Oil and Petroleum Product Prices Increased Sharply in Q1 2026
By the GoldSilver Editorial Team — helping investors understand sound money since 2005. This article is for informational purposes only and does not constitute financial, investment, or tax advice. Always consult a qualified financial advisor before making investment decisions.
You May Also Like:
- What the Warsh Hearing Means for Gold Prices
- IMF Says Treasuries Aren’t Safe Anymore. Gold Noticed First.
- Gold Price After Ceasefire Violation: The Floor Has Moved
- Oil Crashed 11%. Gold Went Up. That Tells You Everything.
- $1 Trillion in Debt Interest Is Why Gold Keeps Climbing
- 5 Signals That Say Gold’s Bull Case Just Got Stronger
- The Largest Gold ETF Outflow Ever – But China Disagrees
- Silver Market Deficit 2026: Six Years and Getting Worse