Published: 05-01-2026, 05:20 pm | Updated: 05-01-2026, 05:32 pm
Gold and silver market update — May 1, 2026
Key Takeaways
- The April 29 FOMC produced four dissents — the most divided vote since 1992 — while Q1 PCE inflation ran at a 4.5% annualized rate, more than double the Fed’s target. The hawks are winning the argument on the data.
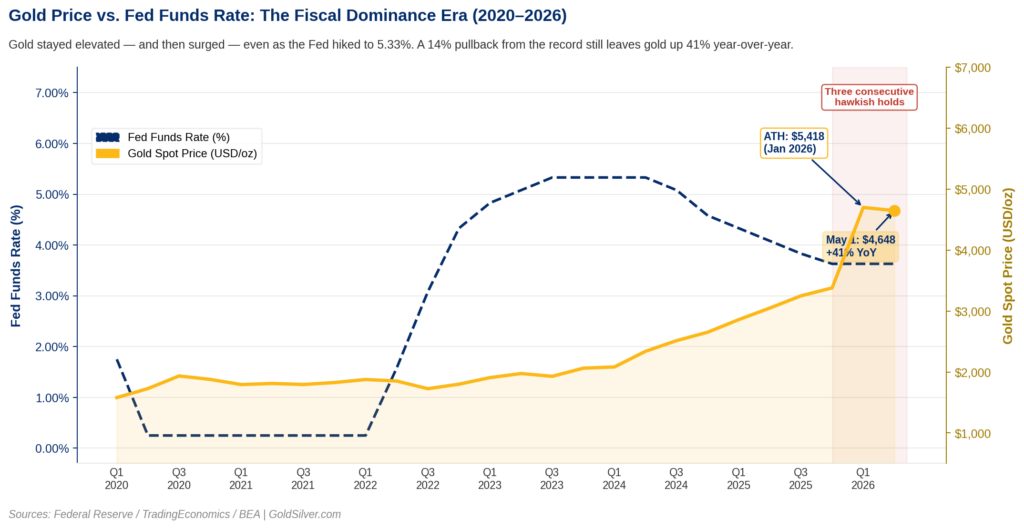
- Gold at ~$4,648/oz is up 41% year-over-year — even after pulling back roughly 14% from January’s record high. That the gains held through a war, three hawkish holds, and a leadership transition is the structural story.
- Fiscal dominance — over $1 trillion in annual US debt interest — limits how hawkish any Fed chair can actually be, including Warsh. The constraint is arithmetic, not political.
The gold price is trading at around $4,600/oz as of 1:24 PM ET on May 1, 2026 — down roughly 1% today, and up 41% from a year ago. It is also down about 14% from January’s record high of $5,418. Both numbers are true.
The 41% is the one worth focusing on. It held through a war, three straight hawkish Fed holds, and now the most fractured Fed vote in 34 years. A 14% pullback from an all-time high, in that environment, is not a breakdown. It is a floor.
What does a four-way FOMC dissent mean for gold?
On April 29, the FOMC voted 8-4 to hold rates at 3.50%–3.75%. It was the first four-member dissent since October 1992. Three regional Fed presidents voted to strip the easing bias from the statement: Beth Hammack (Cleveland), Neel Kashkari (Minneapolis), and Lorie Logan (Dallas). They believe rates should stay higher for longer than the majority is willing to say out loud. Governor Stephen Miran dissented in the opposite direction, pushing for an immediate cut.
The next morning, the Bureau of Economic Analysis (BEA) gave the hawks their evidence. Q1 2026 GDP grew at 2.0% — a genuine rebound from Q4’s near-stall. However, underneath that headline number, inflation surged. The Personal Consumption Expenditures (PCE) price index — the Fed’s preferred inflation measure — ran at a 4.5% annualized quarterly rate, up from 2.9% in Q4. Core PCE, which excludes food and energy, hit 4.3% on the same basis. Year-over-year, headline PCE reached 3.5% in March and core PCE 3.2% — the highest annual readings in approximately two years.
This is not stagflation. The economy is expanding. What the data describes is an inflationary expansion: growth continuing while inflation re-accelerates simultaneously. In that environment, the case for cutting rates isn’t just weak — it’s indefensible. Consequently, Morgan Stanley now forecasts no cuts before 2027.

The Edge Every Investor Needs Smarter precious metals investing starts here. The Nuggets Newsletter brings you essential market insights, Fed updates, global trends, educational videos, and much more.
Can Warsh actually tighten policy with $1 trillion in annual debt interest?
Warsh cleared the Senate Banking Committee on April 29 in a 13-to-11 party-line vote. It was the first fully partisan committee vote on a Fed chair nominee in history. Full Senate confirmation comes no earlier than May 11, and Powell’s term expires May 15.
Warsh has argued publicly for shrinking the Fed’s balance sheet, restoring inflation credibility, and pulling back forward guidance. His hawkish instincts are genuine. But they collide with a hard structural ceiling.
Fiscal dominance is what happens when a government’s debt load grows so large that monetary policy must accommodate borrowing costs instead of controlling inflation. The US government currently pays more than $1 trillion annually just in interest on its debt — at current rates. If Warsh raises rates further, that cost rises. Treasury issuance then expands to cover the gap. Bond yields climb. Eventually, the Fed faces pressure to buy those bonds, expanding the money supply and reigniting the very inflation it set out to fight.
Higher rates create more inflation risk. Lower rates validate it. Either path ends with monetary expansion. This isn’t a political argument about Warsh’s independence. It’s arithmetic.
Why hasn’t the gold price fallen while the Fed holds rates high?
In 1992 — the last time four FOMC members dissented — gold went sideways for a decade. That comparison gets cited often, so it deserves a closer look.
In 1992, the US ran a deficit of roughly $290 billion and carried around $4 trillion in total debt. Today, annual interest payments alone exceed $1 trillion. The fiscal room that allowed Greenspan to restore Fed credibility through the 1990s no longer exists in the same form. That structural condition has fundamentally changed. As a result, the historical parallel breaks down at exactly the point it is most often invoked.
Gold has absorbed the Iran war, three hawkish holds, a divided FOMC, and a leadership transition — and is still holding 41% above where it was a year ago. Every one of those events was a logical reason to sell. Most traders didn’t. A non-yielding asset retaining those gains, in that environment, is the market’s verdict on fiscal sustainability.
Silver at ~$73/oz sits roughly 40% below its January 2026 all-time high of $121.67/oz. The structural supply deficit remains intact. However, silver tracks industrial demand more tightly than gold, and higher-for-longer rates weigh on manufacturing activity. The gold-silver ratio is therefore the clearest signal of when that industrial bid reasserts itself.
Three dates every gold investor should watch before June
The Senate floor vote on Warsh arrives the week of May 11. Powell steps down on May 15. The first FOMC meeting under new leadership — with updated economic projections — is June 17. Markets currently price a 94.9% probability that rates hold in June. If PCE remains elevated before then, the three hawkish dissenters will have more company at that table.
A divided central bank, a new chair walking into a fiscal trap, and a gold price holding 41% above year-ago levels after pulling back from a record high — the next move in this story isn’t about the metals. It’s about whether the incoming Fed chair can thread an arithmetic needle that no central banker has successfully threaded before.
Stay On Top of Gold & Silver Prices
Get important market alerts sent straight to your inbox.
SOURCES
1. Federal Reserve — FOMC Statement, April 29, 2026
2. Federal Reserve — Press Conference Transcript, April 29, 2026
3. Bureau of Economic Analysis — GDP Advance Estimate, Q1 2026
4. Bureau of Economic Analysis — Personal Income and Outlays, March 2026
5. Reuters via Investing.com — Morgan Stanley Sees Fed Holding Rates Steady in 2026
6. CME Group — FedWatch Tool, June 2026 Rate Probabilities
7. TradingEconomics — Gold Price Historical Data, Year-Over-Year Return
8. TradingEconomics — Silver Spot Price, May 1, 2026
9. CNBC — Trump Fed Nominee Kevin Warsh Clears Key Senate Hurdle
10. Congressional Budget Office — Historical Budget Data
Disclaimer: This article is for informational purposes only and does not constitute financial or investment advice. Always consult a qualified financial adviser before making investment decisions.
You May Also Like:
- 5 Economic Warning Signs Gold Investors Need to See Today
- WGC Q1 2026: What Asia Knows That Wall Street Doesn’t
- BEA Stripped Silver From GDP. Here’s What It Means
- PCE at 3.5%, GDP Miss: Why This Is Bullish for Gold
- How Warsh’s Inflation Measure Could Move the Gold Price
- Gold Is Down 19%. This $3.8B Bet Says It Doesn’t Matter
- Gold, Oil, and the Fed: Why the Old Rules Don’t Apply
- Why Turkey Sold Its Gold Reserves — And What It Proves About Sound Money