Published: 06-01-2026, 12:35 pm | Updated: 06-01-2026, 03:59 pm
What to Know
- Silver has two demand pools — industrial and monetary — that usually cancel each other out. Stagflation is the rare condition where both strengthen at the same time.
- Industrial demand won’t fall with the economy. Solar, EV, and AI data center demand is driven by structural mandates — not GDP cycles. Battery-EVs use 67–79% more silver than combustion vehicles (Silver Institute / Oxford Economics).
- The supply deficit is now in its sixth consecutive year. The silver market is projected to run a 46.3 million ounce shortfall in 2026, widening from 40.3 million ounces in 2025 (World Silver Survey 2026). Since 2021, 762 million ounces have been drawn from above-ground reserves.
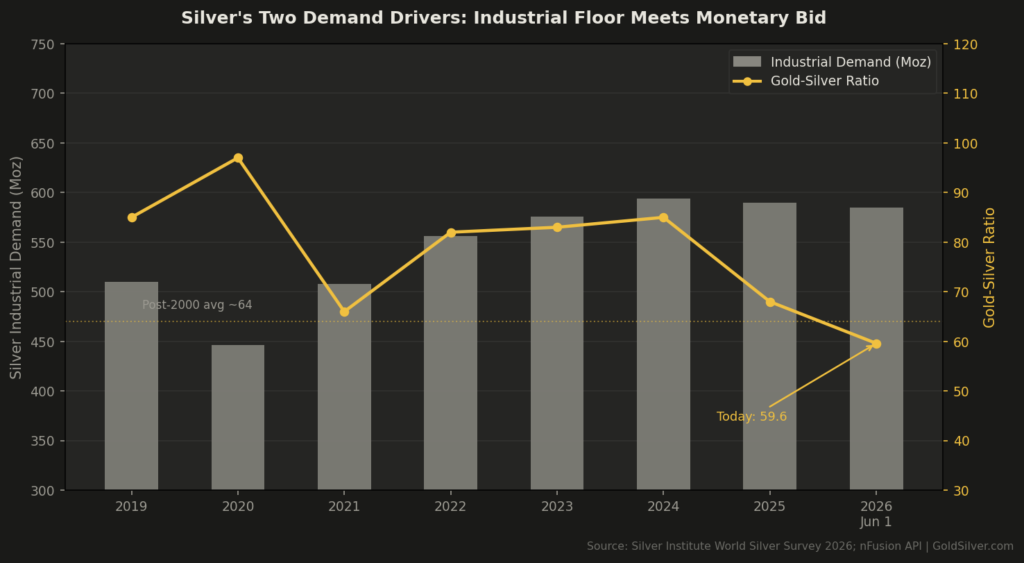
- The gold-silver ratio sits at 60.0 today — near its post-2000 average, well above the January 2026 low of 46:1. The rate-hold is the cause of silver’s underperformance and its structural setup simultaneously.
Most assets have a simple relationship with stagflation. Bonds lose purchasing power. Equities struggle with the growth side of the equation. Cash erodes by definition. Gold wins — inflation is high, real yields are suppressed, the Fed is trapped. The playbook is familiar.
Silver is more interesting. It answers to two entirely separate demand pools — industrial and monetary — that in most macro environments pull against each other. Stagflation is the rare condition where both pull in the same direction simultaneously. Understanding the mechanism tells you why silver’s current position in the market is not what the price action alone suggests.
What Are Silver’s Two Demand Drivers?
Silver answers to two entirely separate demand pools. The first is monetary — held as a store of value, purchased as a safe-haven asset, tracked against gold. The second is industrial — consumed in solar panels, electric vehicles, semiconductors, medical devices, and AI data center infrastructure. Around 58% of global silver demand comes from industrial applications, according to the Silver Institute.
In most macro environments, these two demand pools pull in opposite directions. When growth is strong and inflation is low, industrial demand rises but the monetary bid fades. When a recession hits, the monetary bid strengthens but industrial demand contracts with the economy.
That cross-pull is why silver is historically more volatile than gold. It rarely has both engines firing at once.
Stagflation is the exception.
The Edge Every Investor Needs Smarter precious metals investing starts here. The Nuggets Newsletter brings you essential market insights, Fed updates, global trends, educational videos, and much more.
Why Is Stagflation Uniquely Bullish for Silver?
Stagflation is the simultaneous presence of elevated inflation and below-trend growth. In the United States today: PCE 3.8% for April 2026 (released May 28). GDP growth at 1.6% in Q1 — below trend. The Federal Reserve cannot resolve this cleanly. Cutting rates would signal tolerance for 3.8% inflation. Hiking aggressively would likely push 1.6% growth negative.
The Fed is institutionally paralyzed. Markets have fully priced out rate cuts for 2026. They are now beginning to price in the possibility of a hike that nobody wants to pull the trigger on.
This is financial repression in its clearest modern form. Nominal yields at ~4.47% look attractive until you subtract 3.8% PCE. That’s the official number — and it underweights what real families actually pay for housing, food, and healthcare. The individual saver in this environment is treading water at best.
This is where silver’s second engine turns on. When real yields are barely positive and inflation is persistent, the monetary case for holding sound money assets strengthens. Investors who understand the mechanism hold assets outside the financial system that hold value independent of what any central bank decides. Gold is the obvious beneficiary. Silver moves with it — but silver also has a structural floor that gold doesn’t.
Why Doesn’t Silver’s Industrial Demand Fall With the Economy?
Silver’s industrial demand is not correlated with GDP the way copper or aluminum is.
Copper demand follows construction and manufacturing cycles closely. When growth slows, fewer factories expand, and copper demand contracts.
Silver is different because the applications consuming the most silver are driven not by the business cycle but by multi-decade structural mandates. Solar panel installations are driven by government renewable energy targets and corporate decarbonization commitments. Electric vehicles are driven by fleet electrification mandates and consumer preference shifts that take years to reverse. AI data center buildouts are driven by technology capital expenditure cycles operating on their own logic.
Battery-electric vehicles use 67–79% more silver per unit than combustion engine vehicles, according to the Silver Institute and Oxford Economics. These are not discretionary purchases that pause when growth slows. They are infrastructure decisions that outlast any single recession.
This creates something unusual: an industrial demand floor that holds even when the economy softens. It doesn’t prevent silver from falling during risk-off events — it absolutely can. But it limits how far and how long the industrial bid can disappear, compared to traditional cyclical metals.
Why Can’t Silver Supply Catch Up With Demand?
The floor is harder to appreciate without understanding what’s beneath it: the silver market has been in structural deficit for five consecutive years, and 2026 will be the sixth.
According to the World Silver Survey 2026, published by the Silver Institute and Metals Focus on April 15, 2026, the silver market is projected to record a supply deficit of 46.3 million ounces this year — widening from the 40.3 million ounce shortfall in 2025. Since 2021, the market has drawn down approximately 762 million ounces from above-ground stocks to cover the cumulative gap between supply and demand.
The reason supply cannot easily respond is structural: nearly 70% of silver is mined as a byproduct of other metals — copper, lead, zinc, gold. Silver’s price signal does not drive meaningful new primary mine development at the speed the market needs.
The deficit is widening. The physical market has already drawn down nearly two years of annual mine production from reserves. In that environment, any repricing of demand hits a much tighter physical market than the prior cycle.
What Does the Gold-Silver Ratio Tell Us Today?
The gold-silver ratio — how many ounces of silver it takes to buy one ounce of gold — is one of the simplest ways to track whether these forces are in balance.
Today it stands at approximately 60.0 (gold $4,456.32, silver $74.24 as of June 1, 2026, ~14:59 UTC). The post-2000 average is roughly 60–68:1. The ratio compressed to approximately 46:1 in late January 2026 when silver hit $121. Since then, as the Iran war sent energy prices surging and repriced inflation risk higher, the Fed was forced to abandon its rate-cut path — and silver, more rate-sensitive than gold in the short run due to industrial demand contraction fears, sold off harder.
Silver is still nearly 40% below its January high. Gold is approximately 20% below its own January high.
That gap is explained by the rate mechanism. Rate-hold fear hit silver’s multiple more than gold’s. But here is what the mechanism tells you. The rate hold is simultaneously the cause of silver’s underperformance and the cause of its structural setup. The Fed holding rates with PCE at 3.8% is definitionally financial repression. Financial repression is definitionally the sustained condition that supports monetary metal demand. Silver’s underperformance relative to gold during the rate-hold period is the tension in the system — compression before the monetary bid fully catches up to the industrial floor.
When the Fed eventually pivots — whether to cuts because growth deteriorates, or because holding rates into a slowdown becomes untenable — both engines fire simultaneously. Industrial demand reprices upward as growth expectations improve. Monetary demand reprices upward as real yields fall. The ratio compresses further. That is not a prediction. It is a description of how the architecture works.
What Does This Mean for Your Silver Allocation?
The investor already holding physical silver does not need to act. The mechanism described above is a structural argument for a 3–5 year horizon, not a catalyst for next week.
The investor considering where to position today is looking at silver trading at 60.0:1 relative to gold — near its post-2000 average, well above its January 2026 low, and against a supply backdrop that has now run six consecutive deficit years. That is a different setup than buying silver at 46:1 in January, when everyone had already repriced the stagflation thesis.
The Fed is not going anywhere. PCE is not going back to 2% without either a recession (which historically causes a flight to sound money) or a meaningful rate hike (which compresses growth and eventually forces a pivot). Either path eventually resolves in favor of the dual-engine architecture.
Understanding the mechanism is not the same as predicting the price. But it does something more useful: it tells you what you’re actually holding, and why the structural case for silver in a stagflation environment is not a trade thesis dressed up in economic language.
It’s the honest explanation of how the machine works. That’s what financial sovereignty looks like from the inside.
Stay On Top of Gold & Silver Prices
Get important market alerts sent straight to your inbox.
People Also Ask
What is stagflation and why does it matter for silver?
Stagflation is the simultaneous presence of elevated inflation and below-trend economic growth. It matters for silver specifically because it is the rare macro condition where both of silver’s demand drivers — industrial and monetary — strengthen at the same time. In a normal recession, monetary demand rises but industrial demand falls. In normal growth, the reverse is true. Stagflation eliminates that trade-off.
Why does silver have two separate demand drivers when gold only has one?
Gold functions almost exclusively as a monetary metal — a store of value with negligible industrial consumption. Silver is consumed in solar panels, electric vehicles, semiconductors, AI data centers, and medical devices — around 58% of total demand comes from industrial applications, according to the Silver Institute. That industrial component gives silver a structural demand floor tied to long-term technology buildout, not economic cycles.
What is the gold-silver ratio today, and what does it signal?
The gold-silver ratio stands at approximately 60.0 as of June 1, 2026 (gold $4,456.32, silver $74.24, ~14:59 UTC). The post-2000 historical average is roughly 60–68:1, meaning silver is near the middle of its historical range relative to gold. The ratio compressed to approximately 46:1 in January 2026 when silver hit its all-time high of $121 — the current level reflects silver’s underperformance during the Fed’s rate-hold period, not a structural deterioration in the case for silver.
Is silver a good investment during stagflation?
The structural case for silver in a stagflation environment rests on two simultaneous forces: barely positive real yields strengthen the monetary demand for sound money assets, while structural industrial demand from solar, EVs, and AI infrastructure holds its floor regardless of GDP growth. The silver market is also entering its sixth consecutive year of supply deficit in 2026, with 762 million ounces drawn from above-ground reserves since 2021 (World Silver Survey 2026, Silver Institute / Metals Focus). This is not a short-term trade thesis — it is a 3–5 year structural argument for investors who understand the mechanism.
Why can’t silver miners increase supply to meet demand?
Nearly 70% of silver is mined as a byproduct of other metals — primarily copper, lead, zinc, and gold. This means silver’s own price does not drive meaningful new primary mine development. When silver prices rise, copper and zinc miners do not build new mines in response. Supply is structurally inelastic to silver price signals, which is why six consecutive years of demand exceeding supply has been met by drawing down above-ground reserves rather than increasing production.
SOURCES
1. Silver Institute / Metals Focus — World Silver Survey 2026
2. Metals Focus / Silver Institute — Global Silver Investment to Remain Strong in 2026 Against the Backdrop of a Sixth Consecutive Annual Market Deficit
3. Oxford Economics / Silver Institute — Silver, The Next Generation Metal (December 2025)
4. Published by the Silver Institute — Silver Supply & Demand
5. U.S. Bureau of Economic Analysis — Personal Income and Outlays, April 2026
6. U.S. Bureau of Economic Analysis — GDP Second Estimate and Corporate Profits, 1st Quarter 2026
7. U.S. Department of the Treasury / Federal Reserve — Market Yield on U.S. Treasury Securities at 10-Year Constant Maturity (FRED)
8. nFusion Solutions — Spot metals price feed, gold and silver (June 1, 2026, ~14:59 UTC)
Disclaimer: This article is for informational purposes only and does not constitute financial or investment advice. Always consult a qualified financial adviser before making investment decisions.
You May Also Like:
- The Buyer List for Gold Just Got Longer. These Countries Have Never Bought Before.
- PCE Hit 3.8%. GDP: 1.6%. Gold Went Up. Here’s the Mechanism.
- Gold Targets Are Falling. The $8,000 Forecast Isn’t.
- Gold Radar: 5 Stories the Price Chart Isn’t Telling You
- Silver Lost 3.3% While Gold Lost 1.6%. That Gap Is Not Random.
- Gold Down 1.2%, Silver Down 2.8% — The Floor Holds
- UBS Just Cut Its Gold Target by $400. The Part They Kept Is the Real Story.
- Why Gold Is Falling Today — And Why $4,500 Is Holding.
- Gold Is Down Today. Here’s Why Smart Money Is Still Buying.