Published: 06-05-2026, 03:35 pm
Key Takeaways
- Silver fell ~6% on Friday after the May jobs report; gold fell ~3%
- May NFP 2026: 172,000 jobs vs. 80,000–85,000 consensus — third consecutive beat
- Rate hike odds by year-end: 67% (CME FedWatch, at least one hike of any size), up from 45% last week
- Silver’s industrial engine (~56% of demand) is structurally unaffected by payroll data
- World Silver Survey 2026 (Silver Institute): 46.3 Moz deficit — sixth consecutive year, up 15% from 2025
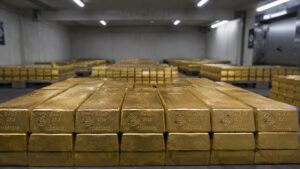
- Cumulative stockpile drawdown since 2021: 762 million troy ounces
- Gold-silver ratio today: ~63 (widening as silver drops harder than gold)
Silver is trading near $72 this afternoon, down nearly 6% since Thursday’s close. Gold fell too — but only about 3%. If you’ve been watching this pattern, you already know: when silver drops, it drops harder. When silver rallies, it rallies harder. The white metal moves like it has something to prove — because structurally, it does.
Today’s driver was the May jobs report. The U.S. economy added 172,000 jobs last month, far above the Dow Jones consensus forecast of 80,000. That’s the third consecutive month the labor market has beaten expectations. The unemployment rate held at 4.3%. Average wages climbed 3.4% year-over-year, according to the Bureau of Labor Statistics.
The immediate read: the Fed can’t cut rates. It might have to raise them. Traders moved fast. CME FedWatch now puts the odds of at least one rate hike before year-end at 67% — up from 45% just last week. The 10-year Treasury yield jumped to 4.54%. The dollar rallied.
Here’s what that does to silver: it hits one of its two engines.

Why Does Silver Move More Than Gold?
Silver runs on two engines. Only one of them cares about the jobs report.
The first engine is monetary. Silver, like gold, is a sound money asset. When real yields rise — when investors can actually get paid something meaningful for holding dollars — the case for non-yielding assets compresses. Rate hike expectations drive real yields higher. That’s textbook pressure on both metals. This is the engine that just took a hit.
The second engine is industrial. Silver is used in solar panels, electric vehicles, AI data center components, and medical equipment. It’s the most electrically conductive element on earth. That’s why roughly 56% of all silver demand comes from manufacturing — not investment, not jewelry.
Checkout – Silver Industrial Demand: Solar, EVs, and the Supply Gap.
Here’s what Friday’s payroll number does to industrial silver demand: nothing. Solar installations scheduled for Q3 don’t care that nonfarm payrolls beat the Dow Jones consensus by 92,000. The EV production lines in Germany and South Korea don’t pause when Kevin Warsh inherits a complicated mandate. The AI data centers consuming silver in their wiring and contacts don’t reorganize based on the Bureau of Labor Statistics.
This is the gap the headline misses. One engine got a headwind. The other didn’t move.
The Edge Every Investor Needs Smarter precious metals investing starts here. The Nuggets Newsletter brings you essential market insights, Fed updates, global trends, educational videos, and much more.
Has the Silver Supply Deficit Changed?
Not by one ounce.
While silver’s price has fallen sharply from its January 29 all-time high of $121.67, the underlying supply picture hasn’t moved in that direction. The Silver Institute’s World Silver Survey 2026 — the definitive annual report on the physical market — projects a 46.3 million ounce deficit this year. That’s up from 40.3 million ounces in 2025. The shortfall widened 15%. The market is now in its sixth consecutive year of deficit.
Since 2021, the world has drawn down approximately 762 million troy ounces from above-ground stockpiles. Those are the Silver Institute’s numbers, and their language is precise: “an era of reduced stocks.”
Supply isn’t responding the way commodity markets usually do. Despite silver averaging $40 per ounce in 2025 — a 42% annual price increase — mine production for 2026 is projected at roughly 844 million ounces, essentially flat versus last year. New mines take five to ten years to bring online. The price signal is there. The supply response isn’t.
That disconnect matters. The market is covering its deficit by drawing down existing stockpiles. That arrangement works until it doesn’t.
What Is the Gold-Silver Ratio Telling Investors?
The ratio today sits near 63 — meaning it takes roughly 63 ounces of silver to buy one ounce of gold. That’s up from around 60 last week, as silver’s sell-off outpaced gold’s on a percentage basis.
Historically, when both metals sell off together on macro headwinds, silver tends to overcorrect — then snap back once the monetary pressure stabilizes.
Checkout – Silver Dropped 12%. Gold Dropped 3%. That Gap Is the Story. The gap between the two metals often narrows faster than most investors expect, once the triggering catalyst fades.
What Does This Mean for Sound Money Investors?
Silver’s price reflects two things at once. First: what markets think about real yields and monetary policy. Second: what manufacturers need to build the infrastructure of the next decade. The first reprices fast — intraday on a payroll number. The second moves slowly — it shows up in multi-year supply-demand statistics that don’t care about any individual Friday.
When the two engines align — loose monetary policy and strong industrial demand — silver tends to outperform gold significantly. When they split, as they did today, silver takes the bigger short-term hit. But one number printing hot doesn’t rewrite the structural supply story that’s been building since 2021.
Today’s session tells you about rate expectations. The World Silver Survey tells you about ounces. The ounces are still running short.
That’s not a forecast. That’s arithmetic.
Stay On Top of Gold & Silver Prices
Get important market alerts sent straight to your inbox.
SOURCES
1. Bureau of Labor Statistics — The Employment Situation, May 2026
2. Axios — Markets anticipate higher interest rates after strong jobs report
3. CNBC — 10-year Treasury yield shoots higher above 4.53% after strong jobs report
4. CNBC — Jobs report May 2026: U.S. added 172,000 jobs, unemployment at 4.3%
5. Silver Institute — World Silver Survey 2026: Sixth Consecutive Annual Market Deficit
6. InvestingNews — Silver Institute: Sustained Supply Deficit Exposes Market to Squeezes
7. MiningVisuals — Silver Supply and Demand: A 2026 Update
8. InvestingNews — Silver’s Record-Breaking Surge: The All-Time High Price
9. Barchart — Gold and Silver Price Analysis, June 2026
10. Trading Economics — Silver Price Chart and Historical Data
11. Morningstar — May Jobs Report Shows Strong Hiring, but a Fed Rate Hike Isn’t a Done Deal
12. RBC Economics — US May Jobs Report: Broadening Gains, White-Collar Weakness, and a Leisure Distortion
Disclaimer: This article is for informational purposes only and does not constitute financial or investment advice. Always consult a qualified financial adviser before making investment decisions.
You May Also Like:
- Gold Rate Hike Fears Are Weighing on Prices. Here’s the Full Picture.
- Gold at $4,480: Physical Demand Hits a 50-Year Milestone
- Gold Holds $4,481 With Rate Hike Risk Rising. Here’s the NFP Decision Map.
- Gold Surges 1.5%: ADP, ISM, and Beige Book Trap the Fed
- Gold at $4,454 Says the Fed Is Trapped. Here’s Why.
- Central Banks Picked Gold Over Treasuries. Should You?
- Central Banks Just Crossed a Line Not Seen Since 1996
- Factory Costs Hit 82.1. That Number Is Now Working for Your Gold.
- Gold at $4,500: What Fort Knox, China, and Silver Are Telling You
- Silver Has Two Engines. Stagflation Is the One Condition That Fires Both at Once.
- The Buyer List for Gold Just Got Longer. These Countries Have Never Bought Before.