Published: 06-22-2026, 09:35 am | Updated: 06-22-2026, 09:45 am
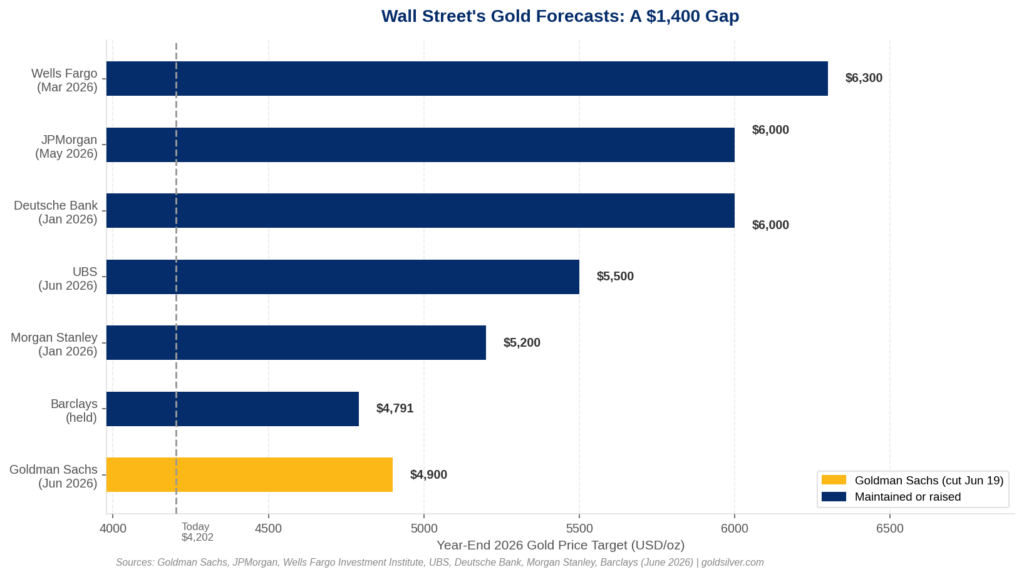
On June 19, Goldman Sachs analysts Lina Thomas and Daan Struyven cut their year-end gold price target from $5,400 to $4,900. Specifically, Goldman no longer believes the Federal Reserve will cut rates at all in 2026, so the bank pushed its first expected cut to June 2027.
JPMorgan did not move. Its year-end target remains $6,000. Wells Fargo Investment Institute, which raised its target to $6,100–$6,300 in March 2026, has not moved either. Deutsche Bank still holds $6,000.
Gold is trading at $4,202 as this publishes. The spread between Goldman’s floor and Wells Fargo’s ceiling is $1,400. That gap is not noise. In fact, it tells you something precise about how each bank thinks about gold.
Why Goldman Sachs Moved
Goldman’s gold model is rate-dependent. Specifically, the bank’s own research quantifies the relationship: every 50 basis points of Federal Reserve easing adds approximately $120 per ounce of support to gold, because it lowers the opportunity cost of holding a non-yielding asset and weakens the dollar [Goldman Sachs Global Investment Research, June 2026].
When Goldman Sachs economists expected one rate cut in late 2026 and one in early 2027, that rate-path support was baked into the $5,400 target. On June 17, Fed Chair Kevin Warsh presided over his first FOMC meeting and stripped forward guidance from the policy statement entirely. Nine of the 18 policymakers who submitted projections now project at least one rate hike in 2026 — Chair Warsh did not submit a dot [Federal Reserve, Summary of Economic Projections, June 2026]. As a result, Goldman’s economists removed all 2026 cuts from their forecast.
The math is straightforward. Pull one cut in late 2026 and one in early 2027 from the model, and you lose roughly $240 per ounce in rate-support by Goldman’s own formula. Additional cuts to ETF flow assumptions account for the rest of the reduction. The result is $4,900, with $4,400 as the explicit downside scenario if the Fed actually hikes [Mining.com, June 20 2026].
Goldman’s own language in the note: “structurally constructive but tactically cautious.”

The Edge Every Investor Needs Smarter precious metals investing starts here. The Nuggets Newsletter brings you essential market insights, Fed updates, global trends, educational videos, and much more.
Why JPMorgan and Wells Fargo Didn’t
JPMorgan’s $6,000 year-end target rests on a different foundation. The bank’s framework weights quarterly demand tonnage as the primary price driver: how much gold central banks, ETFs, and physical buyers are absorbing each quarter. Moreover, JPMorgan’s own research estimates that this relationship explains approximately 70% of the quarter-over-quarter change in gold prices [JPMorgan Global Research, May 2026].
On that metric, nothing material has changed. Central banks bought 244 tonnes of gold in Q1 2026, including unreported purchases estimated by the World Gold Council [World Gold Council, Q1 2026 Gold Demand Trends]. The People’s Bank of China added 9.95 tonnes in May alone, extending its buying streak to 19 consecutive months [Heraeus Precious Metals, June 2026].
Furthermore, approximately 45% of central banks surveyed plan to continue growing their gold reserves over the next year [World Gold Council, Central Bank Survey 2026]. Those institutions are not adjusting reserve policy based on whether the Fed cuts in September or December.
Wells Fargo’s March 2026 upgrade to $6,100–$6,300 cited the same structural floor: sustained central bank demand, the potential for Fed rate cuts, and elevated policy uncertainty [Wells Fargo Investment Institute, March 28 2026]. The bank argued explicitly that the correction was a buying opportunity, not a reversal. It still holds that view.
Two Different Theories of What Gold Is
The gap between Goldman Sachs ($4,900) and JPMorgan ($6,000) does not represent two analysts looking at the same data and arriving at different conclusions. Rather, it represents two fundamentally different answers to the same question: what is gold?
Goldman’s model treats gold primarily as a rate-sensitive macro asset. It is a hedge against low real yields and dollar weakness. When those tailwinds fade, the target moves. That framework is valid for market participants who hold gold as a tactical bet on the rate cycle.
JPMorgan and Wells Fargo, by contrast, treat gold as a reserve asset. Central banks accumulate it to reduce dollar exposure in sovereign balance sheets. That demand does not respond to Fed meeting outcomes. It is structural, decades-long, and tied to the slow fracturing of the dollar’s reserve dominance.
Both frameworks are internally coherent. However, the question for any individual investor is which one actually describes their own reason for owning gold.
Owning gold because you expect the Fed to cut rates soon means Goldman’s model is the one to watch. If, on the other hand, you own gold because you believe monetary systems built on persistent deficit spending eventually erode purchasing power over time, the JPMorgan and Wells Fargo framework is closer to your thesis. The two answers require watching completely different data points.
What Thursday’s PCE Data Does and Doesn’t Change
Thursday’s Personal Consumption Expenditures price index for May will move gold on the day it releases. The Cleveland Fed’s inflation tracking model projects May core PCE at 3.3% year-over-year, unchanged from April [Cleveland Fed Inflation Nowcasting, June 2026]. A hot print reinforces the Goldman Sachs downside scenario. A soft print, however, reduces rate-hike pressure and may bring tactical buyers back.
Importantly, the central banks buying 244 tonnes per quarter are not waiting for Thursday’s number. They were not waiting for the June FOMC meeting, either. Their purchase decisions run on a timescale that makes any single PCE print essentially irrelevant.
That distinction between the rate trader’s gold and the reserve manager’s gold is exactly what the $1,400 gap makes visible.
Stay On Top of Gold & Silver Prices
Get important market alerts sent straight to your inbox.
SOURCES
1. Goldman Sachs Global Investment Research — Gold Price Target Revision, June 19 2026
2. Federal Reserve — FOMC Statement and Summary of Economic Projections, June 2026
3. JPMorgan Global Research — Gold Price Forecast 2026, May 2026
4. Wells Fargo Investment Institute — Gold Price Target Revision, March 28 2026
5. World Gold Council — Gold Demand Trends Q1 2026
6. Mining.com — Goldman Cuts Gold Price Forecast to $4,900, June 20 2026
7. GoldSilver — Gold & Silver Spot Prices, June 22 2026
8. Federal Reserve Bank of Cleveland — Inflation Nowcasting, June 2026
Disclaimer: This article is for informational purposes only and does not constitute financial or investment advice. Always consult a qualified financial adviser before making investment decisions.
You May Also Like:
- Gold Price Today, June 19: What Juneteenth Trading Tells You
- Half the Fed Wants a Hike. 45% of Central Banks Are Buying More Gold.
- Silver Hit $69.85 This Morning. Then the FOMC Took It All Back.
- The Fed Went Silent. Gold Holders Don’t Need It to Speak.
- Five Signals That Say Gold’s Correction Is a Reset, Not a Reversal
- The Fed Just Killed Its Rate Roadmap. Here’s What That Means for Gold.
- Gold Holds at $4,347 While Stocks Hit All-Time Highs. Here’s Why.