Published: 06-22-2026, 12:15 pm | Updated: 06-22-2026, 12:21 pm
Key Takeaways
- PCE is the Fed’s preferred inflation gauge. It adjusts for consumer substitution and captures a broader basket than CPI. That makes it the number most directly tied to the Fed’s rate decisions.
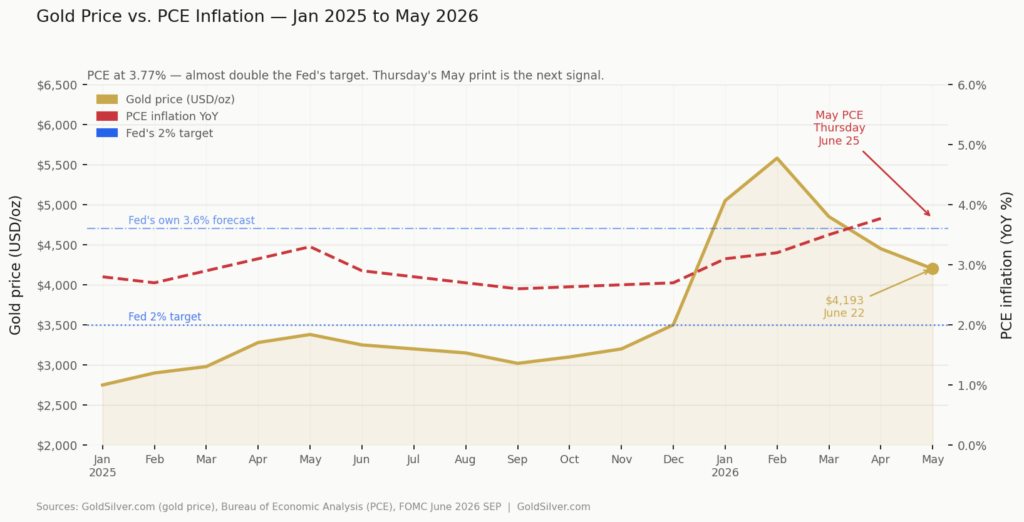
- May PCE drops Thursday, June 25. Core PCE ran at 3.3% in April. A hot print at or above the Fed’s 3.6% year-end forecast extends rate-hike pressure on gold. A soft print below 3.4% could sharply reprice the two-thirds December hike probability and open a path to $4,400.
- The structural case for sound money doesn’t hinge on one release. With real yields barely positive, central banks buying gold at record pace, and the Fed’s own projections showing inflation above target through year-end, the mechanism that makes gold a long-term purchasing power protector remains intact regardless of Thursday’s number.
Gold is trading at $4,193 this Monday — recovering from last week’s $4,150 low. The US and Iran agreed on a 60-day peace roadmap in Switzerland, sending oil roughly 2% lower. Silver is at $66.05, outperforming gold today after last week’s 4.5% drop [GoldSilver, Gold & Silver Spot Prices, June 22, 2026].
But the biggest story this week isn’t Iran. It’s a three-letter acronym arriving Thursday morning: PCE.
What Is PCE Inflation — and Why Does the Fed Use It Instead of CPI?
Most investors follow CPI — the Consumer Price Index. It’s the number that makes headlines. However, the Federal Reserve operates on a different measure: the Personal Consumption Expenditures price index, released monthly by the Bureau of Economic Analysis.
The difference matters. CPI measures a fixed basket of goods. PCE adjusts for how consumers actually behave. For example, if beef gets expensive and people switch to chicken, PCE captures that shift. As a result, PCE typically runs 0.3 to 0.5 percentage points lower than CPI. It’s considered a more accurate reflection of real-world inflation costs.
PCE also covers a broader set of categories. It includes healthcare costs paid by insurers on your behalf, financial services, and other items CPI doesn’t fully capture.
The last PCE reading — for April — came in at 3.77% year-over-year on the headline. Core PCE, which strips out food and energy, ran at 3.3% [Bureau of Economic Analysis, April 2026]. The Fed’s own target: 2%. Their own revised year-end forecast: 3.6% [Federal Reserve Summary of Economic Projections, June 2026]. In other words, they’re projecting inflation at almost double their mandate through the end of 2026. Yet rates remain parked at 3.50–3.75%. That gap is the setup.

The Edge Every Investor Needs Smarter precious metals investing starts here. The Nuggets Newsletter brings you essential market insights, Fed updates, global trends, educational videos, and much more.
How Does Thursday’s PCE Print Affect Gold Prices?
Thursday’s May PCE reading is the most consequential data point for precious metals this week — possibly this month.
PCE feeds directly into the Federal Reserve’s rate-hike calculus. After the June FOMC meeting, 9 of 19 policymakers projected at least one rate hike before year-end [Federal Reserve Summary of Economic Projections, June 17, 2026]. That hawkish shift drove Treasury yields higher, strengthened the dollar, and kept sustained pressure on gold — from over $4,400 to last week’s $4,150 low. As of June 22, futures markets embed roughly a two-thirds probability of at least one hike by December [CME FedWatch].
Real yields are the bridge between the PCE print and gold prices. When inflation runs higher than nominal yields, real yields compress. Moreover, low real yields mean holding cash or bonds loses purchasing power over time. Gold, which pays no interest, then becomes comparatively attractive.
Conversely, when the Fed signals hikes and nominal yields climb faster than inflation, real yields rise. Gold, priced against those yields, faces headwinds.
Right now, the 10-year Treasury sits at approximately 4.48% [US Treasury, June 22, 2026]. With PCE at 3.77%, real yields are roughly +0.7 percentage points — barely positive. One hot PCE print could push the hike timeline forward, extending gold’s pressure. One soft print could undermine the entire rate-hike narrative.
Two scenarios for Thursday’s print:
If May PCE comes in at or above 3.6% — the Fed’s own year-end target — it validates the nine hawkish dots. Therefore, a December hike becomes the floor, not the ceiling. The dollar stays firm, real yields hold elevated, and gold likely remains under pressure in the $4,100–$4,200 range.
If May PCE comes in below 3.4% — a genuine downside surprise — the rate-hike case weakens quickly. As a result, Fed futures will reprice, the dollar softens, real yields compress, and gold has a clear path back toward the $4,400 range that preceded the June FOMC.
Why Is the Energy Component Complicating This Week’s Reading?
May’s CPI showed that energy drove more than 60% of the monthly price gain [Bureau of Labor Statistics, May 2026 CPI Summary]. The Iran conflict kept oil prices elevated throughout most of May. That energy component flows directly into PCE’s headline number — which is why analysts expect May PCE near 4.1%.
Here’s the complication: Brent crude fell roughly 2% today on the Iran peace news. That’s meaningful — but for June prices, not May. Thursday’s report measures what happened in May. Consequently, the potential energy relief from today’s oil drop would show up in the June PCE reading, which won’t be released until late July.
In practice, Thursday’s print may still look elevated. It captures the Iran-driven energy spike before peace talks changed the calculus. If so, the market’s reaction will depend on whether traders treat the reading as backward-looking or as a signal for what the Fed must do next.
Why Don’t Long-Term Gold Holders Need to Lose Sleep Over One Number?
Here is the “second corner” the rate-hike narrative keeps walking past.
The Federal Reserve’s own projections show PCE staying well above 2% through 2026. Furthermore, national debt exceeds $36 trillion — roughly 125% of GDP. The Fed under Chair Kevin Warsh faces a structurally constrained version of the same dilemma it has faced since 2022: inflation above target, growth soft, and debt service obligations that become significantly harder to manage as rates rise.
Meanwhile, central banks globally bought 244 tonnes of gold in Q1 2026 — the highest Q1 on record [World Gold Council, Gold Demand Trends Q1 2026]. China has added to its gold reserves for at least 18 consecutive months. The “smart money” in sovereign treasury management is not positioned for a world where central banks sustain real positive yields for years. Instead, they’re positioned for the world the math suggests: one where inflation proves stickier than the policy rate, and where gold’s lack of counterparty risk becomes more valuable over time.
Consider this: your savings account currently earns around 3.63% [Vanguard VMFXX 7-day yield, June 21, 2026]. PCE inflation is running at 3.77%. In other words, you are earning negative real returns on cash today. That’s not a crisis — but it is a quiet, steady erosion of purchasing power that doesn’t show up on any statement.
Thursday’s print will move markets. Watch for it. But one number doesn’t change the structural equation.
What Should You Watch This Week?
Thursday, June 25: The Bureau of Economic Analysis releases May PCE alongside the final Q1 GDP revision and initial jobless claims. Focus on core PCE — the number that excludes food and energy and the one the Fed weighs most heavily. Prior reading: 3.3% year-over-year.
Price levels to watch: Gold support at $4,100–$4,150. Resistance at $4,400.
The real question Thursday: Does the energy disinflation that’s building in June already show up in May’s reading — or is the print still dominated by the Iran-driven oil spike? That single question will define gold’s next move.
Stay On Top of Gold & Silver Prices
Get important market alerts sent straight to your inbox.
SOURCES
1. GoldSilver — Gold & Silver Spot Prices, June 22, 2026
2. Bureau of Labor Statistics — Consumer Price Index Summary, May 2026
3. Bureau of Economic Analysis — PCE Price Index, April 2026
4. Federal Reserve — Summary of Economic Projections, June 2026
5. CME Group — FedWatch Tool, June 22, 2026
6. World Gold Council — Gold Demand Trends Q1 2026
7. US Treasury — 10-Year Constant Maturity Rate, June 22, 2026
8. Vanguard — VMFXX 7-Day SEC Yield, June 21, 2026
9. GoldSilver — Gold Price Outlook June 2026
Disclaimer: This article is for informational purposes only and does not constitute financial or investment advice. Always consult a qualified financial adviser before making investment decisions.
You may also like:
- Goldman Sachs Gold Target Cut: What the $1,400 Gap Means
- Gold Price Today, June 19: What Juneteenth Trading Tells You
- Half the Fed Wants a Hike. 45% of Central Banks Are Buying More Gold.
- Silver Hit $69.85 This Morning. Then the FOMC Took It All Back.
- The Fed Went Silent. Gold Holders Don’t Need It to Speak.
- Five Signals That Say Gold’s Correction Is a Reset, Not a Reversal
- The Fed Just Killed Its Rate Roadmap. Here’s What That Means for Gold.
- Gold Holds at $4,347 While Stocks Hit All-Time Highs. Here’s Why.