Gold and silver market update — April 24, 2026
Key Takeaways:
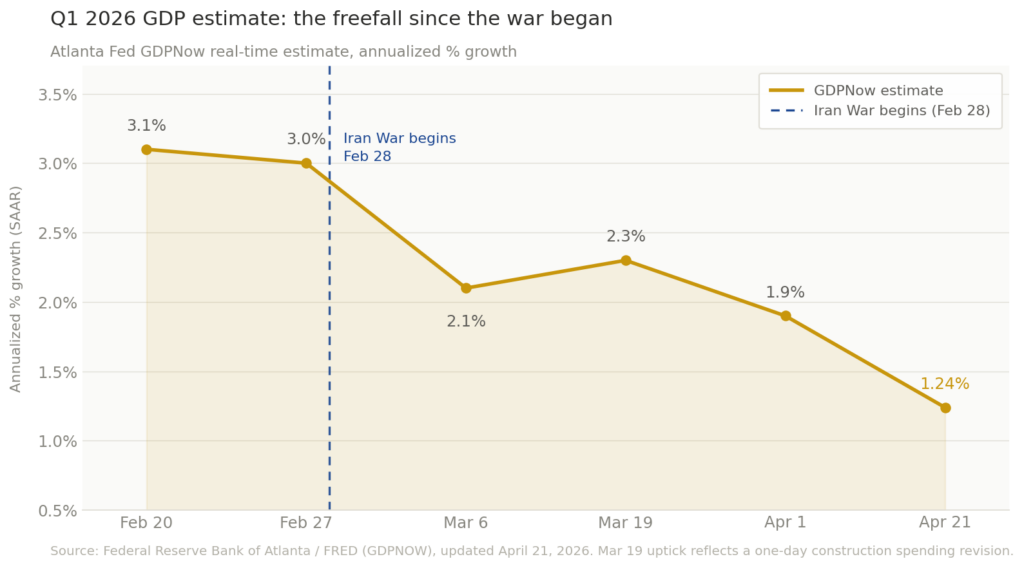
- GDPNow (April 21): Atlanta Fed projects Q1 2026 GDP at 1.24% annualized — down from 3.1% in late February (Federal Reserve Bank of Atlanta / FRED)
- GDP release date: The BEA’s official Q1 advance estimate drops April 30 at 8:30am EDT — the day after Powell’s final FOMC press conference as Fed chair
- The stagflation setup: GDP at ~1.24% + CPI at 3.3% (BLS, April 10) + Brent at $106 (April 24) = the conditions where the Fed cannot act and gold’s opportunity cost compresses toward zero
- Both scenarios favor gold: A weak print confirms financial repression; a stronger print leaves every structural driver — deficit, central bank buying, Hormuz — fully intact
- Watch the PCE deflator: If growth is weak and PCE is hot in the same release, stagflation moves from analyst commentary to confirmed official data
Everyone is watching the FOMC meeting on April 29 — Powell’s press conference, the hold that’s already priced in.
The more important number for gold drops the day after.
On April 30, the Bureau of Economic Analysis releases its advance estimate of Q1 2026 GDP at 8:30am EDT. The Atlanta Fed’s GDPNow model is projecting Q1 growth at 1.24% annualized, as of its April 21 update. In late February, that figure was 3.1%. That freefall captures the gold price stagflation April 2026 setup in a single data point.
Running alongside CPI at 3.3% (BLS, April 10) and Brent crude at $106, this defines stagflation: slow growth and persistent inflation at the same time. It’s the economic environment where the Fed has no clean options — and one of the few where gold’s case strengthens regardless of which way the Fed moves next.
What does weak Q1 GDP mean for the gold price in April 2026?
Q4 2025 GDP came in at just 0.5% annualized — its lowest reading in years. Q1 was supposed to be the rebound. In late February, GDPNow was tracking 3.1%. Then the war began on February 28, Brent crossed $100, and the growth estimate started falling. By April 1 it was 1.9%. By April 21 it was 1.24%.
The April 30 print is therefore the first official number showing what the Iran War actually did to the US economy. The soft landing vs. stagflation debate has run for weeks on estimates and surveys. April 30 ends that debate with hard data.
Two scenarios — and gold wins either way.
Scenario A: GDP prints near 1.24% or weaker. The gold price stagflation April 2026 thesis is confirmed, and the Fed is paralyzed. It can’t cut — CPI is 3.3%, oil is $106. It can’t raise — the economy is already slowing. This is financial repression: the central bank cannot offer savers a real positive return, so demand for assets held outside the financial system rises. In every prior stagflationary period — the 1970s oil shock, the early 1980s transition — gold significantly outperformed. Physical gold benefits not because of fear, but because the arithmetic of a negative real yield makes holding cash the losing trade.
Scenario B: GDP surprises higher, toward 2% or above. The soft landing narrative revives and the Fed holds with patience. However, the Congressional Budget Office’s $1.9 trillion projected deficit for FY2026 doesn’t change. Central bank gold buying forecast at 850 tonnes for 2026 (World Gold Council) doesn’t change. The structural case for gold is intact.

Stay Ahead with Gold & Silver News The most important market insights, Fed updates, and global trends — everything investors need to make smarter, safer decisions.
Why is the Fed trapped — and what does that mean for savers?
Understanding gold price stagflation April 2026 risk starts with one question: what happens when the Fed can’t move in either direction? Financial repression occurs when a central bank holds interest rates below the rate of inflation. In practice, this transfers purchasing power from savers to borrowers and governments.
The Fed can’t cut without risking an inflation blowout. It can’t raise with growth at 1.24%. That bind leaves real yields on cash negative or barely positive. As a result, the opportunity cost of holding physical gold — which carries no yield but holds purchasing power — compresses toward zero.
The central bank buying data reflects this directly. According to the World Gold Council, official-sector buyers are forecast to purchase roughly 850 tonnes of gold in 2026. That is nearly matching the 863 tonnes bought in 2025 — the third consecutive year above 800 tonnes. Poland, China, Kazakhstan, Malaysia, and South Korea are all active buyers. They are not trading short-term price moves. Instead, they are diversifying away from fiat currencies on a multi-decade horizon. A trapped Fed, a $1.9 trillion deficit, and a closed Strait of Hormuz all point to the same long-term outcome: sustained erosion of fiat purchasing power.
What should gold holders watch in the April 30 release?
So far, the gold price stagflation April 2026 picture has been built on estimates, surveys, and nowcasts. April 30 changes that.
The headline GDP number is only part of the picture. The same release also contains the PCE price deflator — the Fed’s preferred inflation gauge, and broader than the headline CPI figure.
If GDP prints weak and the PCE deflator prints hot simultaneously, stagflation becomes confirmed official data, not a forecast. That combination — slow growth and hot inflation confirmed in one BEA report — is what the market hasn’t priced in. It would be the most significant data moment for gold since the war began.
Three numbers to watch on April 30:
- Headline GDP: Below 1.5% confirms the GDPNow trajectory; above 2.0% challenges it
- PCE price deflator: Any acceleration above Q4 2025’s reading deepens the stagflation case
- Real final sales to private domestic purchasers: This strips out volatile inventory swings and gives the cleanest read on underlying demand
The April 29 FOMC hold is priced in at 99.5% (CME FedWatch, April 24). For anyone tracking gold price stagflation April 2026 risk, that asymmetry is the point. April 30, by contrast, is not priced in at all.
Investing in Physical Metals Made Easy

SOURCES
1. Federal Reserve Bank of Atlanta — GDPNow Q1 2026 Real-Time Tracking
2. U.S. Bureau of Economic Analysis — GDP Third Estimate, Q4 2025
3. U.S. Bureau of Labor Statistics — Consumer Price Index, March 2026
4. Congressional Budget Office — Budget and Economic Outlook: 2026 to 2036
5. World Gold Council — Central Bank Gold Statistics
6. CNBC — Brent Oil Tops $105 as Tensions Simmer in Strait of Hormuz
7. CME Group — FedWatch Tool
By the GoldSilver Editorial Team — helping investors understand sound money since 2005. This article is for informational purposes only and does not constitute financial, investment, or tax advice. Always consult a qualified financial advisor before making investment decisions.
You May Also Like:
- Gold Price Today: What to Watch Before the April 29 FOMC
- What’s Driving Gold Prices? Oil, PMI, and Newmont
- Dollar Weakens, Gold Falls — and That’s Actually Bullish
- Why Chinese Silver Imports Hit a Record in 2026
- What Drives Gold Prices? 5 Forces Investors Are Watching Now
- The Gold-Silver Ratio Signal: What Silver’s Lead Means
- Gold Drops to $4,681 — Iran Ceasefire Expires Today
- The Real Reason Gold Is Down During an Oil War